
This article was originally published in AQUILA’s 2Q 2021 Austin Office Market Report. This article will not be updated, but please contact us if you have specific questions regarding the information in this article.
Austin continues to rank as one of the best places to live and work each year. A quick look at our growing population and the strong Austin job market confirms that a lot of people agree.
In 2020, Austin had the highest net migration rate (according to LinkedIn) and was named America’s Best Job Market by the Wall Street Journal. To explore Austin’s job market and reputation further, we’ve taken a look at the Austin employment market at both a macro and micro level.
Read Next: Austin Office Market Recovery Dashboard
With the help of employment data provided by Emsi, in this special report we take a deep dive into Austin’s employment environment and look into:
- Top jobs in Austin today
- Where employees live and work
- Job postings and hiring trends
Top Jobs in Austin Today
If you had to guess what the most common occupation in Austin is today, what would you say? If you said something in the technology sector, you’d be correct.
According to Emsi’s data on five-digit Standard Occupational Classification (SOC) codes, the occupation with the most total employees
with a bachelor’s degree in the Austin-Round Rock-Georgetown MSA is Software Developers and Software Quality Assurance Analysts and Testers. That’s a long, official-sounding name that encompasses more common job titles like software developer, software engineer, applications developer, and systems analyst.
Below is a summary of the top 10 occupations in Austin today that require a bachelor’s degree.
Top 10 Occupations in Austin Today That Require a Bachelor’s Degree
| Occupation | 2019 Jobs | 2020 Jobs | Change (2019 to 2020) | % Change |
| Software Developers and Software Quality Assurance Analysts and Testers | 22,371 | 23,720 | 1,349 | 6% |
| General and Operations Managers | 22,052 | 22,833 | 781 | 4% |
| Project Management Specialists and Business Operations Specialists, All Other | 14,614 | 16,226 | 1,612 | 11% |
| Registered Nurses | 14,344 | 14,155 | (189) | -1% |
| Accountants and Auditors | 10,752 | 10,559 | (193) | -2% |
| Elementary School Teachers, Except Special Education | 9,210 | 9,104 | (106) | -1% |
| Computer Systems Analysts | 8,263 | 7,884 | (379) | -5% |
| Substitute Teachers, Short-Term | 7,087 | 6,642 | (445) | -6% |
| Management Analysts | 5,766 | 6,379 | 613 | 11% |
| Market Research Analysts and Marketing Specialists | 5,745 | 6,082 | 337 | 6% |
As for the jobs that have been growing the fastest, the software developer occupation mentioned above ranks at the top of the list again. Between 2010 and 2020 there were 11,405 roles filled that fall under that SOC code, a 93% increase. To put that growth into perspective, between 2001 and 2010 there were only 3,287 new jobs added under that SOC code, which still made it the fastest-growing occupation during that time period but was less than 30% of the growth seen in the last 10 years.
Read Next: Why Austin Is a Great Place for Your Business
Below is a summary of the top 10 growing occupations in Austin today that require a bachelor’s degree.
Top 10 Growing Occupations in Austin Today That Require a Bachelor’s Degree
| Occupation | 2010 Jobs | 2020 Jobs | Change (2010 to 2020) | % Change |
| Sales Engineers | 846 | 3,648 | 2,802 | 331% |
| Substitute Teachers, Short-Term | 1,864 | 6,642 | 4,778 | 256% |
| Market Research Analysts and Marketing Specialists | 2,182 | 6,082 | 3,900 | 179% |
| Project Management Specialists and Business Operations Specialists, All Other | 6,128 | 16,226 | 10,098 | 165% |
| Computer and Information Systems Managers | 2,037 | 4,703 | 2,666 | 131% |
| Human Resources Specialists | 2,487 | 5,273 | 2,786 | 112% |
| Management Analysts | 3,077 | 6,379 | 3,302 | 107% |
| General and Operations Managers | 11,535 | 22,833 | 11,298 | 98% |
| Software Developers and Software Quality Assurance Analysts and Testers | 12,315 | 23,720 | 11,405 | 93% |
| Registered Nurses | 9,178 | 14,155 | 4,977 | 54% |
Though the growth of technology-focused jobs should come as no surprise, it is interesting to see that roles in the medical and teaching fields have ranked highly on these lists. This is a good reminder that Austin’s growing workforce creates many secondary jobs needed to support the increased number of families moving to our city.
Where Employees Live and Work in the Austin Area
After digging into the top occupations at the MSA level, we now zoom in to take an even more granular look at the zip code level to see where the employees in those roles live and work.
For the sake of this analysis, we’ve combined the top 10 occupations in Austin today from the table above.
The map below shows the concentration of resident workers in each zip code based on where the employee lives. The darker zip codes have a higher concentration of people living in the area than the lighter zip codes.
Concentration of Resident Workers Based on Where the Employee Lives
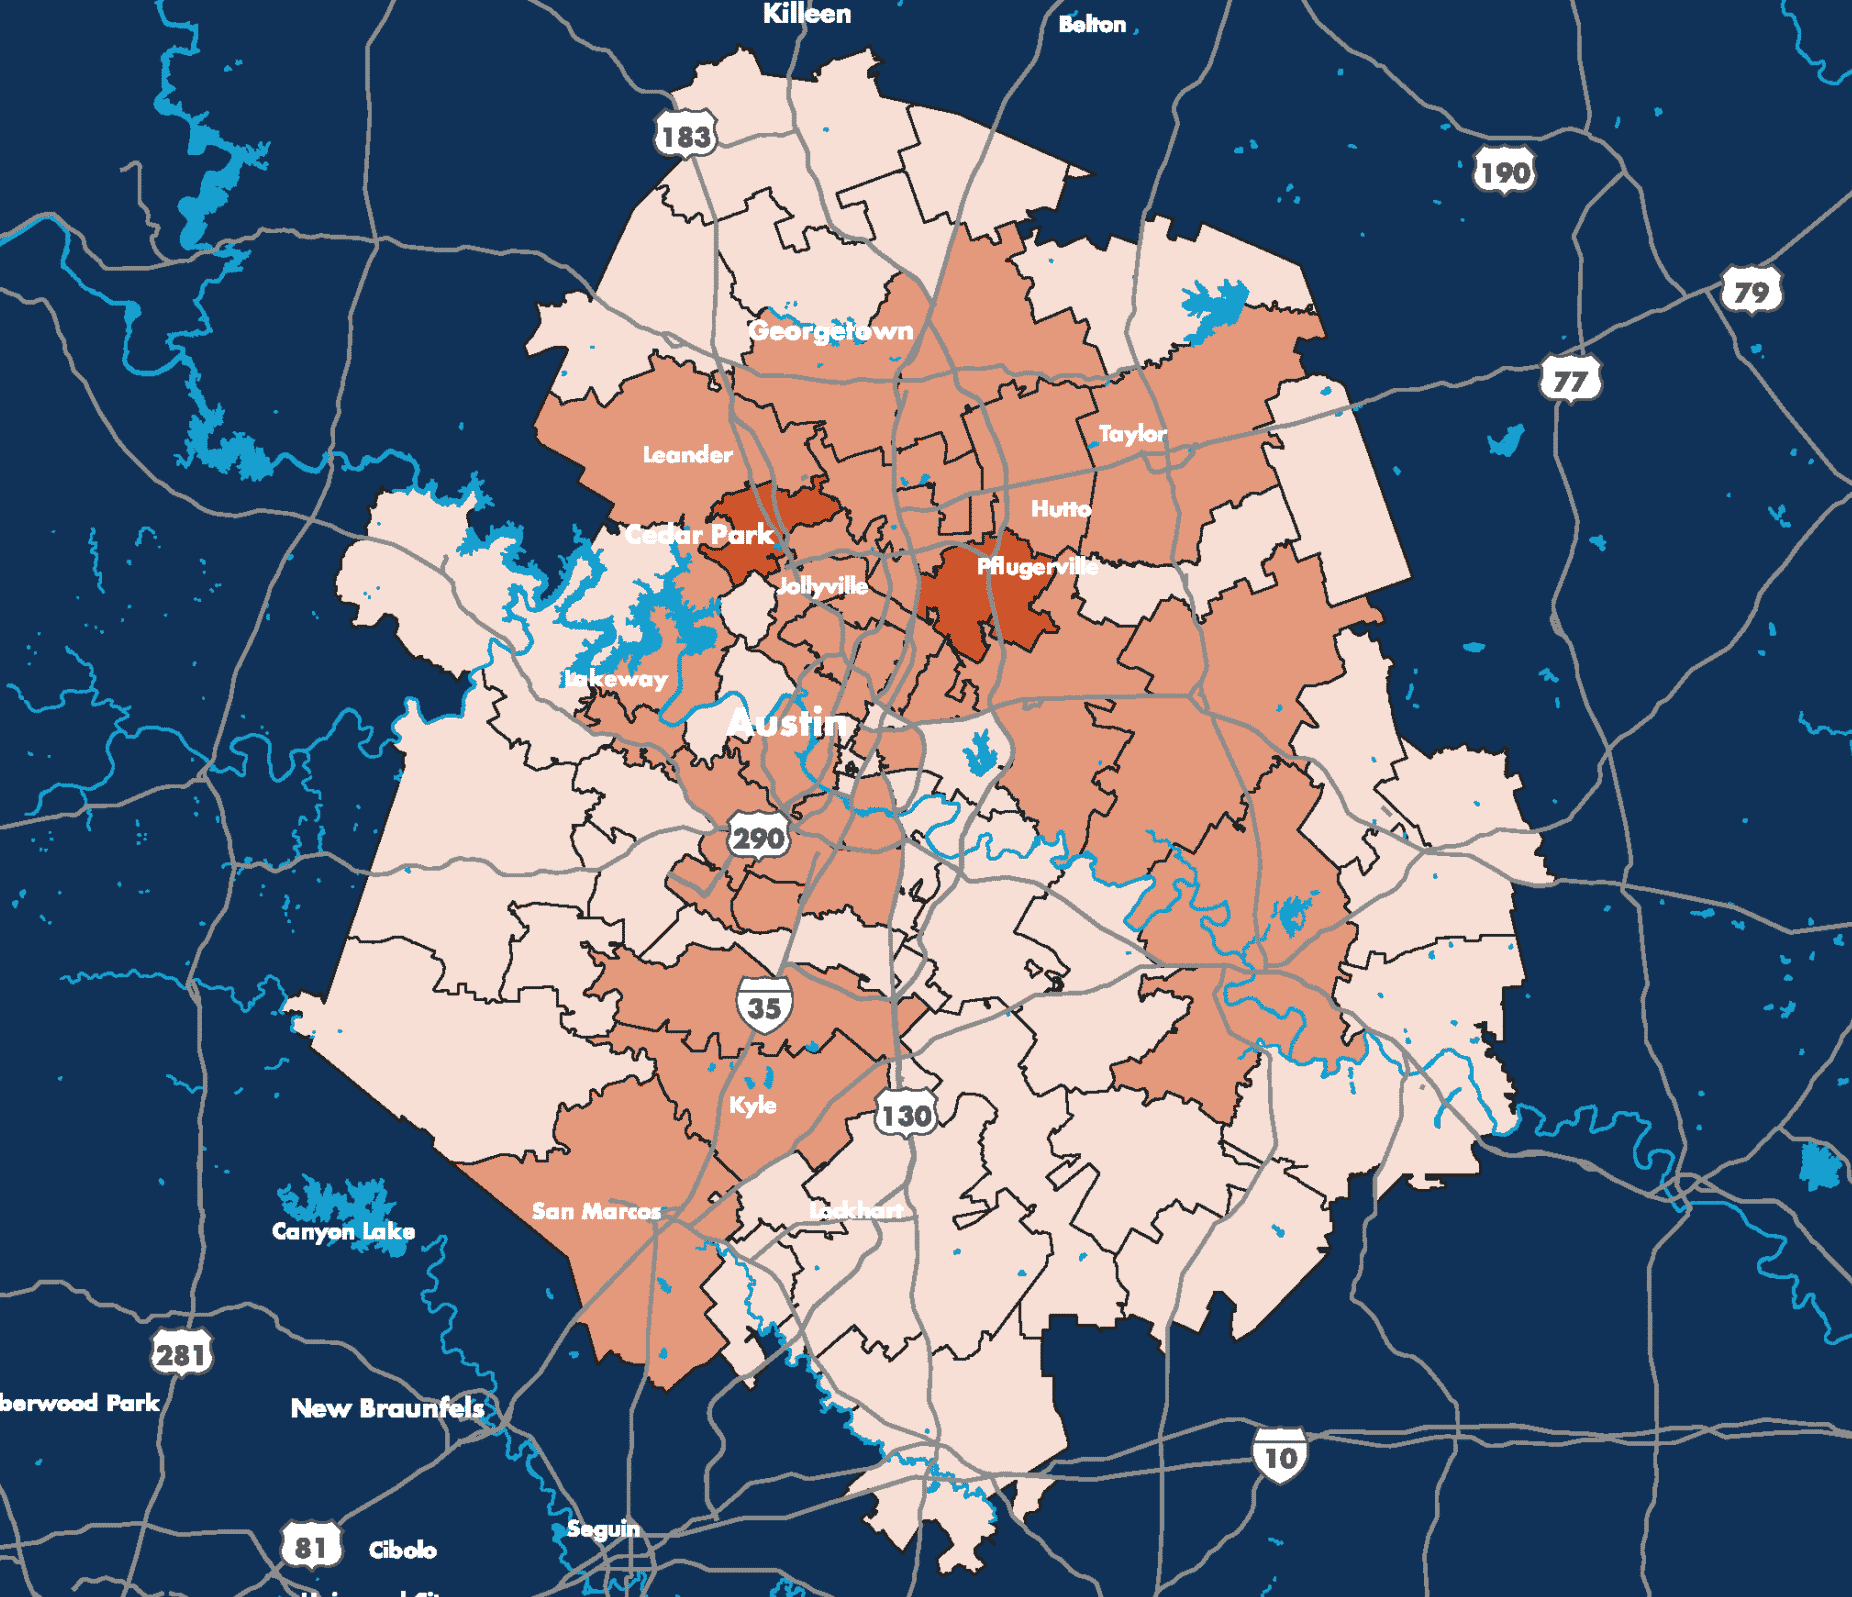
As you can see, there is a relatively higher concentration of employees in these occupations living in the north and northwest regions of the MSA, with a high concentration around Pflugerville, Cedar Park, and Leander. There is also a decent concentration in South Austin.
However, this map only tells half of the story. Although we now know where the employees live, we don’t know where they work. That’s where our next map comes in.
Net Commuters From Each Zip Code in the Austin Area


The map above shows the “net commuters” from each zip code. Blue areas indicate more employees are traveling to the area than live there, and red areas show zip codes where a majority of employees are leaving the area each day to work elsewhere. While our previous map showed us that a majority of employees in these occupations live in the north and northwest regions of the MSA, this map shows that most of those employees are driving to work elsewhere. Employees living in the zip codes surrounding Cedar Park, Leander and Pflugerville appear to primarily be driving to work in zip codes around Austin’s downtown, southwest, and the Domain.
This trend does make sense, as most of Austin’s large tech companies are located in the downtown and Domain areas. However, this analysis does help confirm what you might have already assumed and presents an interesting argument for a need for more office space in North and Northwest Austin.
WANT THIS REPORT AS A PDF?
Want to share this report with a colleague, save to your desktop for later, or print a copy for your records?
We know digital isn’t always the right format. For that reason, you can download a free PDF copy of this report.

Job Postings and Hiring Trends in Austin
Now we know the top existing jobs in Austin, where those employees live and where they travel to work every day. But what might the job market look like moving forward? To answer that, we look at current job postings and hiring trends.
As of May 2021, there were 41,425 unique job postings in the Austin-Round Rock-Georgetown MSA posted in the last 30 days (non-remote), with a median advertised salary of $21.62 per hour (roughly $45,000 per year) according to Emsi. This volume of postings is above the volume seen in early 2020, prior to COVID-19.
Job Postings Over Time (2017 to 2021)
Limiting the search to full-time jobs only, the volume of postings decreases slightly to 37,861, and the median salary increases slightly to $23.72 per hour. One caveat to note is that many employers do not publicly advertise salary information on their full-time job postings, so this hourly wage is likely skewed low since job postings with salary information tend to be entry-level positions.
Unsurprisingly, the occupation with the most job postings is our familiar SOC code that has made an appearance throughout this article, Software Developers and Software Quality Assurance Analysts and Testers. This occupation accounts for 2,938 unique postings, or 7% of the total full-time positions being advertised. Of course, 2,938 postings doesn’t necessarily mean there will be 2,938 new software developers in the next few months; but, this number does give a good indication of where hiring trends might be headed.
The other top occupations being hired for, regardless of required education level, can be seen below.
Top Occupations Being Hired For, Regardless of Required Education Level
| Occupation | Unique Postings (May 2021) | Median Posting Duration (Days) |
| Software Developers and Software Quality Assurance Analysts and Testers | 2,938 | 9 |
| Registered Nurses | 1,940 | 7 |
| Computer Occupations, All Other | 1,395 | 9 |
| Marketing Managers | 1,265 | 10 |
| Heavy and Tractor-Trailer Truck Drivers | 1,241 | 8 |
| Customer Service Representatives | 784 | 8 |
| First-Line Supervisors of Office and Administrative Support Workers | 631 | 10 |
| Management Analysts | 584 | 11 |
| First-Line Supervisors of Retail Sales Workers | 574 | 8 |
| Computer User Support Specialists | 565 | 9 |
So, which firms are responsible for all of these job postings you might be asking? In short, tech companies.
Dell currently leads with 359 postings for full-time jobs in the MSA (non-remote) in the last 30 days, with job titles ranging from software developer to product management consultant. The other big tech companies aren’t far behind, with IBM, Amazon, Facebook, and Oracle all ranking high on the list.
| Company | Unique Postings (May 2021) | Median Posting Duration (Days) |
| Dell | 359 | 6 |
| IBM | 325 | 12 |
| Oracle Corporation | 256 | 14 |
| Amazon | 222 | 9 |
| 212 | 16 | |
| HCA Holdings | 195 | 11 |
| Deloitte | 191 | 13 |
| Accenture | 190 | 9 |
| Baylor Scott & White Health | 186 | 12 |
| Ascension | 163 | 12 |
It’s interesting to note that three healthcare companies, HCA Holdings (partner of St. David’s HealthCare), Baylor Scott & White Health, and Ascension, also made the top 10. The companies are hiring for roles like patient care technicians, registered nurses, pharmacy technicians, and registered respiratory therapists. It seems Austin is not only a good city to find a tech job, but a healthcare job as well.
Conclusion
With a job market like this, Austin is clearly on an upward trajectory and is quickly breaking through the temporary lull in activity caused by the COVID-19 pandemic. Although unemployment is still sitting at 4.5% as of April 2021 (compared to a low of 2.3% in April 2019), we are nowhere near the high of 11.8% experienced in April 2020.
If unemployment continues to stay low, job postings continue to be filled and companies continue to choose our city to locate their offices, warehouses, and stores, we are hopeful that the best is yet to come for Austin, Texas.