This article was originally published in AQUILA’s 1Q 2021 Austin Office Market Report. This article will not be updated, but please contact us if you have specific questions regarding the information in this article.
There’s no doubt about it, the events of 2020 caused a major shift in Austin’s office sublease market. At some points new sublease spaces were being listed at such a rapid pace that it was hard to keep up, and, for those experiencing a recession from within the real estate industry for the first time (like myself), it was hard to believe how quickly the office market could change.
Read Next: Who Owns the Most Office Space in Austin?
Now that we are past 2020 and the Austin office market appears to be on a road to recovery, I wanted to take a step back and analyze the state of the sublease market as it stands today. Using CoStar, I’ve compiled some interesting facts and figures that shed some light on different aspects of the market.
In this article, I examine the current Austin office sublease market in a number of ways, including:
- How many subleases hit the market after April 2020?
- Where are the majority of subleases located?
- How long are the average sublease terms?
- What are the largest subleases on the market?
How Many Subleases Hit the Austin Office Market After April 2020?
For starters, let’s take a look at the sheer volume of sublease space listed in Austin since early 2020.
As you can see, the onset of COVID-19 provoked a drastic increase in sublease listings in the second quarter of 2020. Interestingly, whether by coincidence or precognition, the “true” uptick in space began in 4Q 2019. (Did those tenants know something the rest of us didn’t?)
Austin Office Sublease Volume
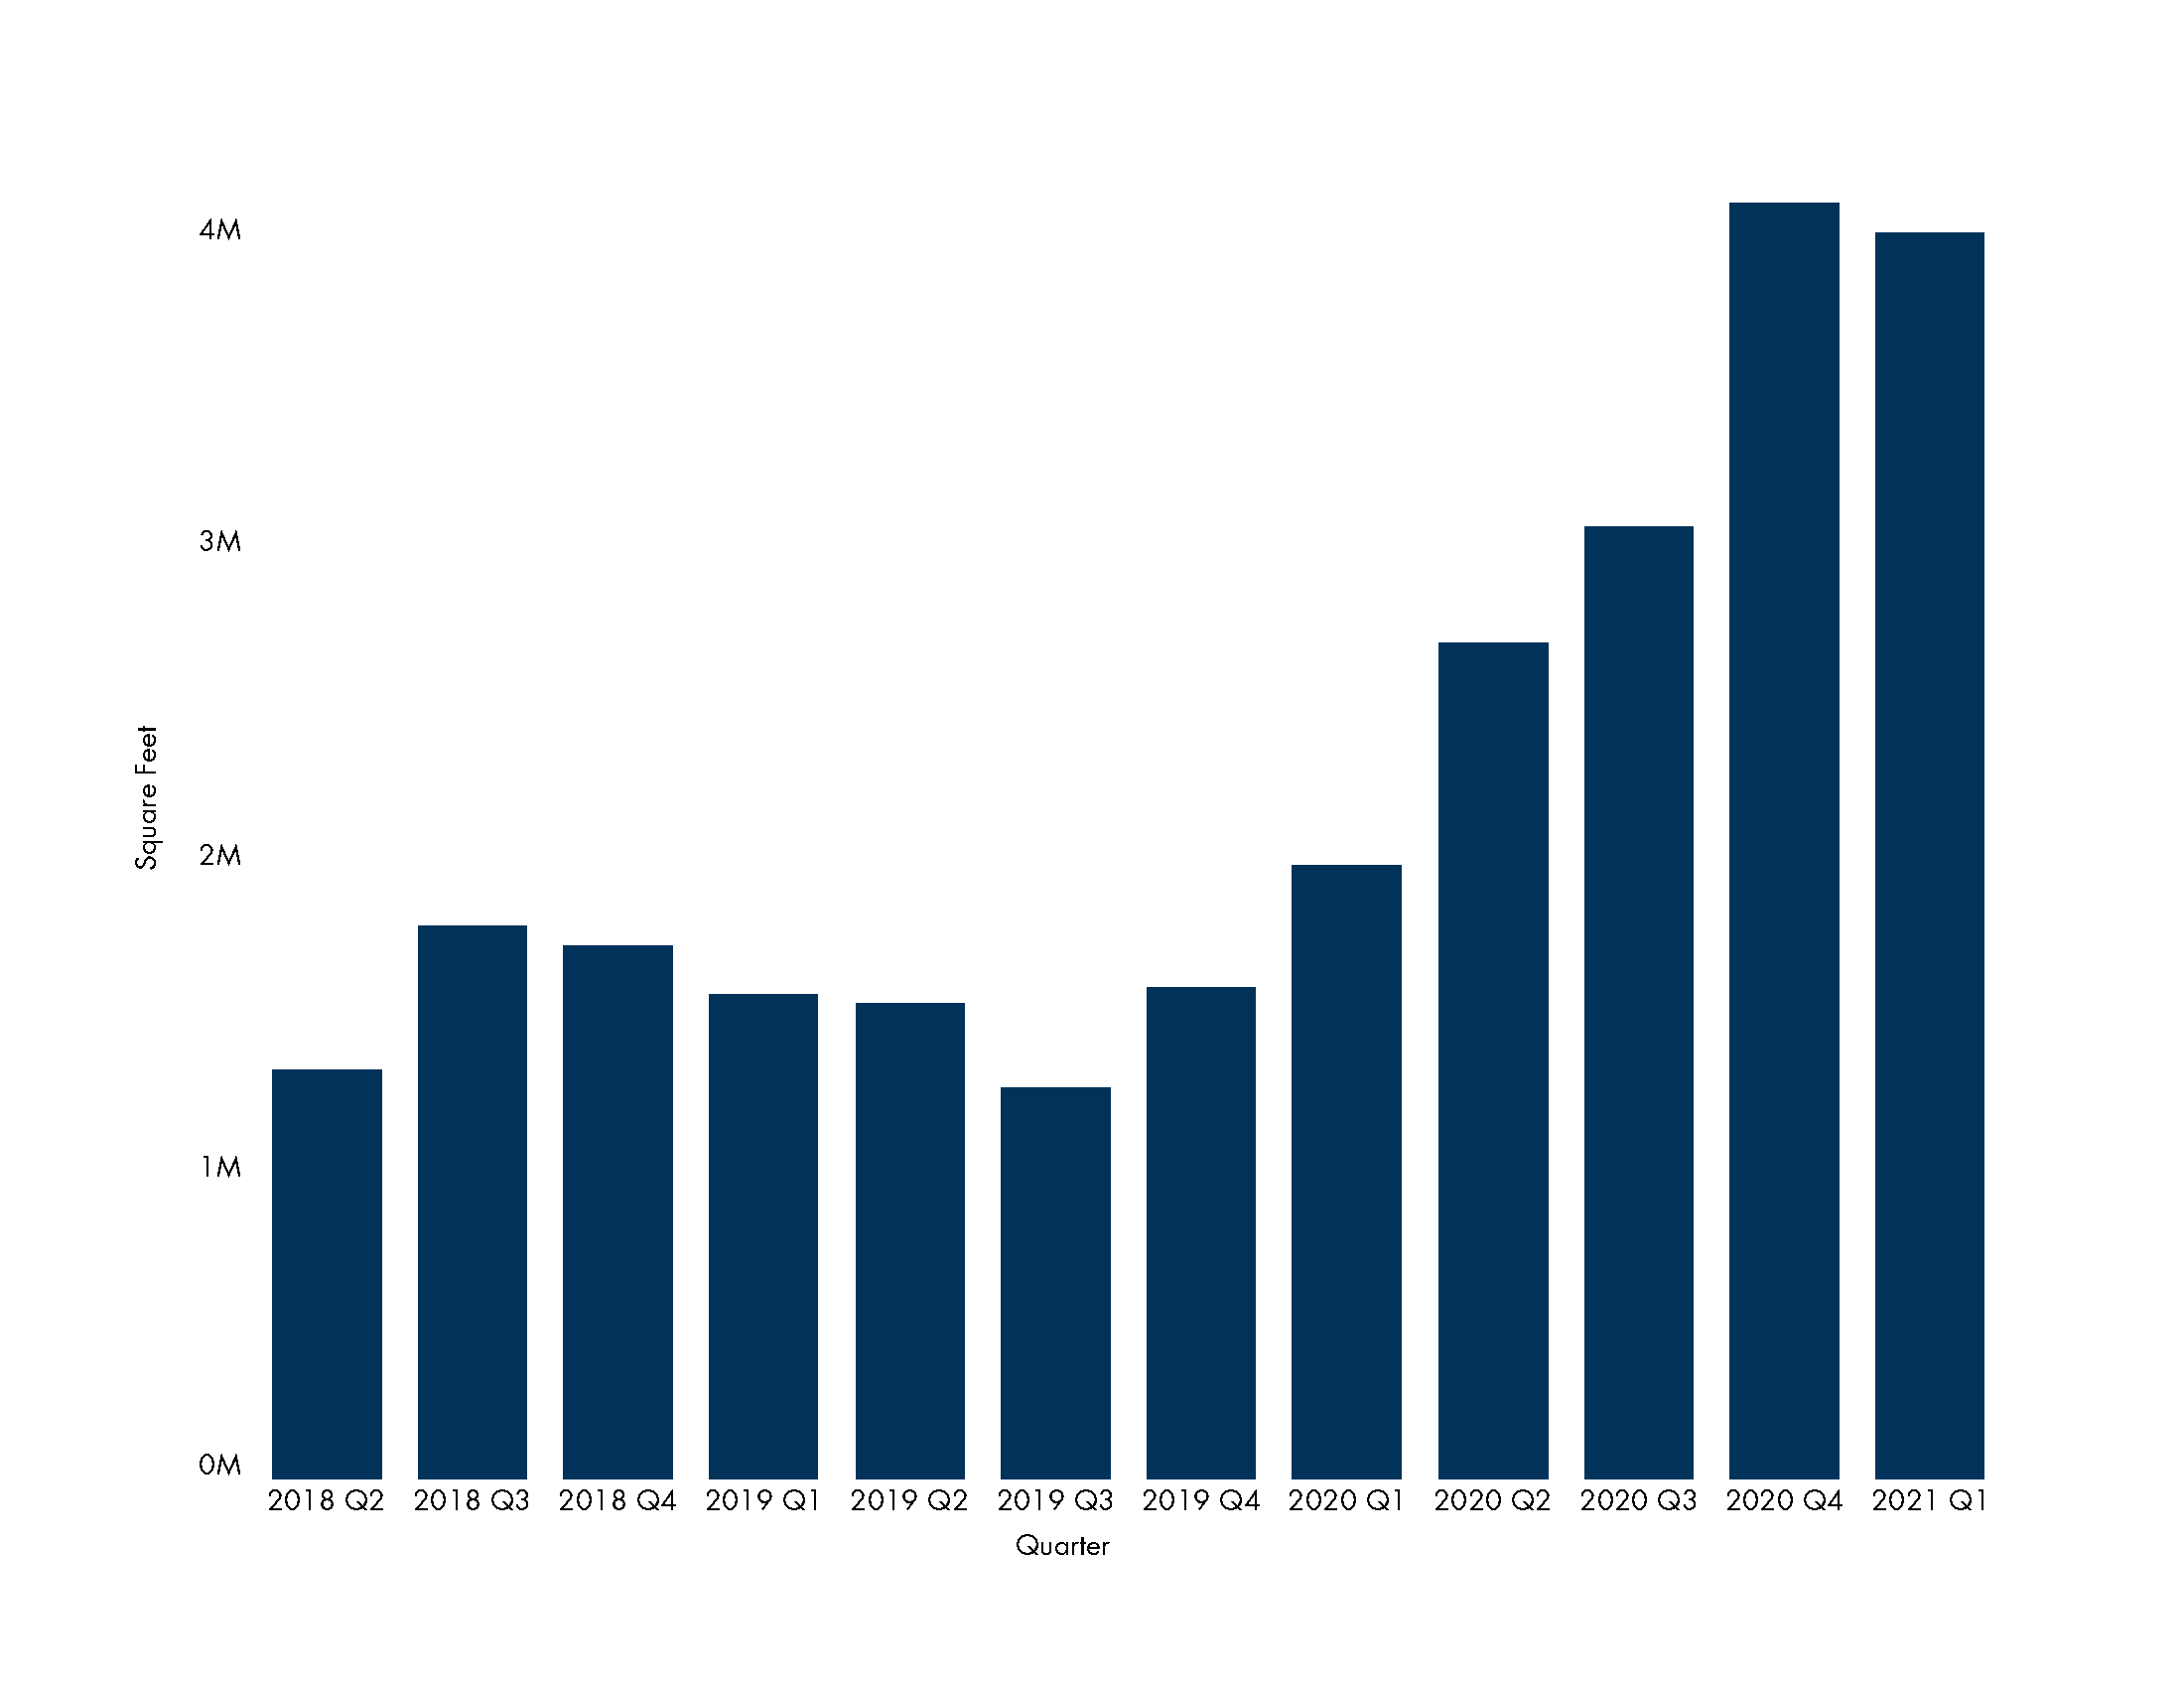
As of the end of 1Q 2021, the volume of office sublease space on the market is roughly double what it has been in recent years. To frame that differently, the current volume of sublease space makes up roughly 4% of the existing office market tracked by CoStar today, compared to 1.5% of the market in 1Q 2019. For more historical perspective, the peak sublease availability rate following the Dot-Com Bust was upwards of 6% for CoStar’s building set and was 2% following the Great Recession.
That said, 1Q 2021 saw a slight decrease from the previous quarter, so it does seem that the wave of space has now subsided and will (hopefully) begin to recede through the rest of 2021.
Read Next: What Are the Largest Companies in Austin, Texas Today?
Where Are the Majority of Austin’s Subleases Located?
Looking at sublease volume on a citywide basis is interesting, but personally, I find it more compelling to break it down by submarket. From the chart below you can probably tell why.
Sublease Volume by Submarket
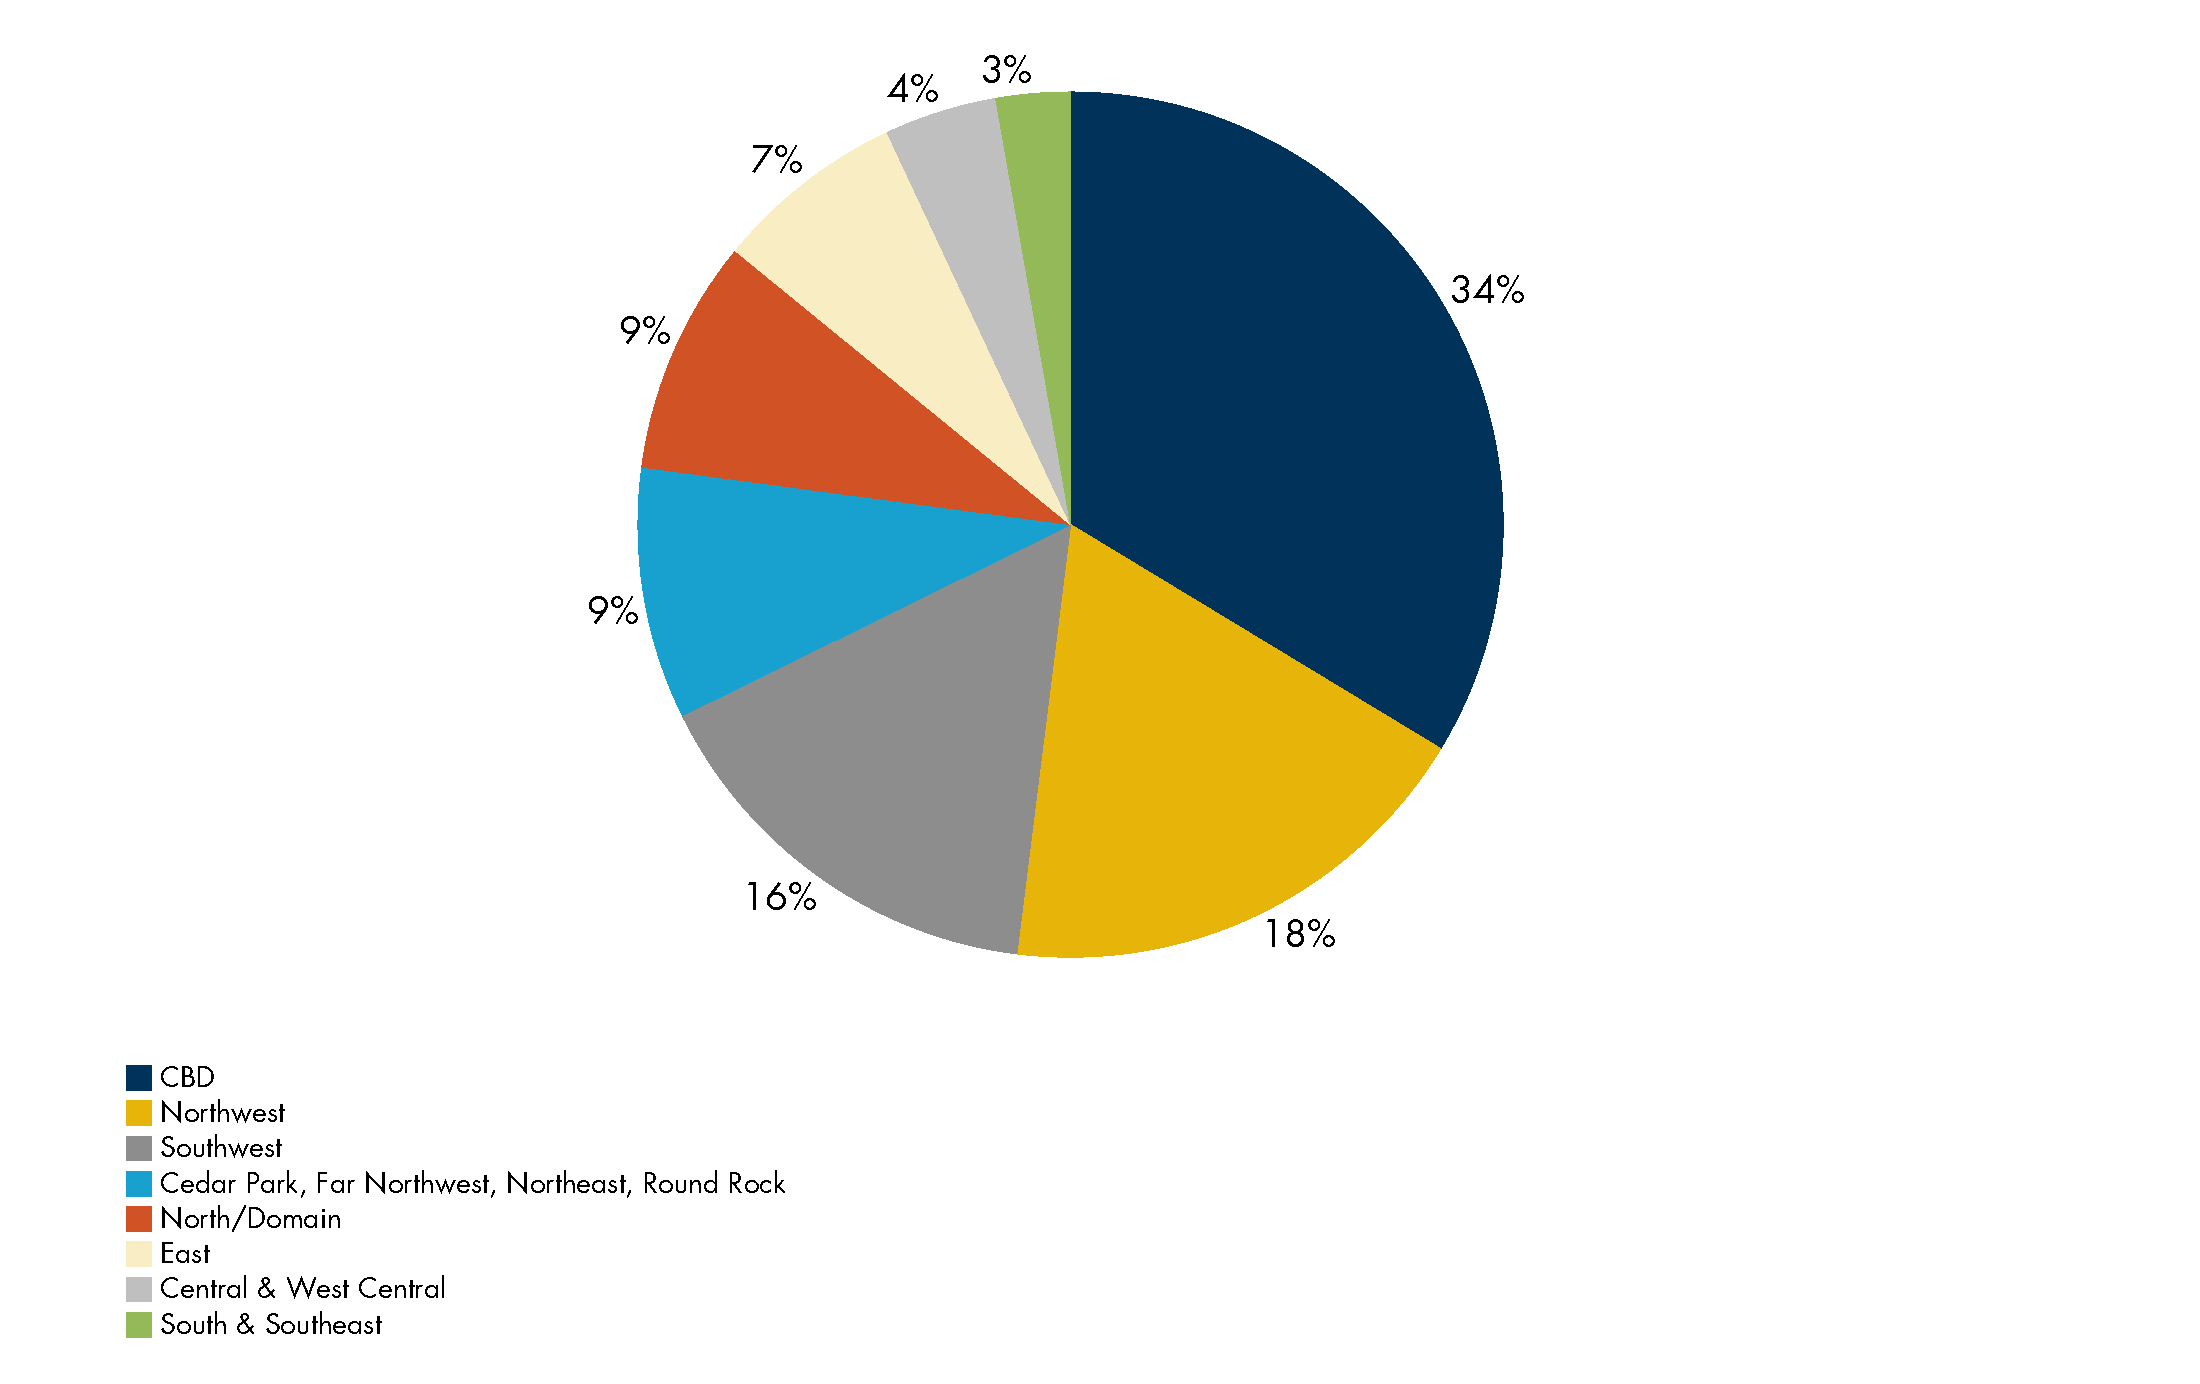
Austin’s CBD accounts for 19% of the existing and under-construction office space in the city but accounts for 34% of the total sublease volume on the market today. Compare that to the Northwest (17% of total, 18% of sublease) and Southwest (15% of total, 16% of sublease) and it’s clear that the CBD has been hit exceptionally hard as far as subleases are concerned.
There could be a few reasons for this, but the simplest explanation is likely a combination of the CBD’s comparatively higher rental rates mixed with the growing uncertainty around high-density, elevator-dependent buildings in the wake of COVID-19. It could also be that the CBD simply has had larger sublease spaces hit the market, which seems to be the case.
How Long Are the Average Sublease Terms in Austin’s Office Sublease Market?
The term remaining on a sublease is arguably one of the most important factors. Usually, a sublease with less than a year remaining is harder to lease than one with multiple years left. After all, most companies don’t want to move into a sublease space only to find themselves having to negotiate a new lease within a few months.
As you can see from the chart below, the majority of the sublease square footage is listed with a “negotiable” term. This could be for a number of reasons, so it’s hard to make a general conclusion about why so many spaces would be categorized like this. The second-highest volume of space has roughly three years of term remaining as of this quarter.
Months of Term Remaining
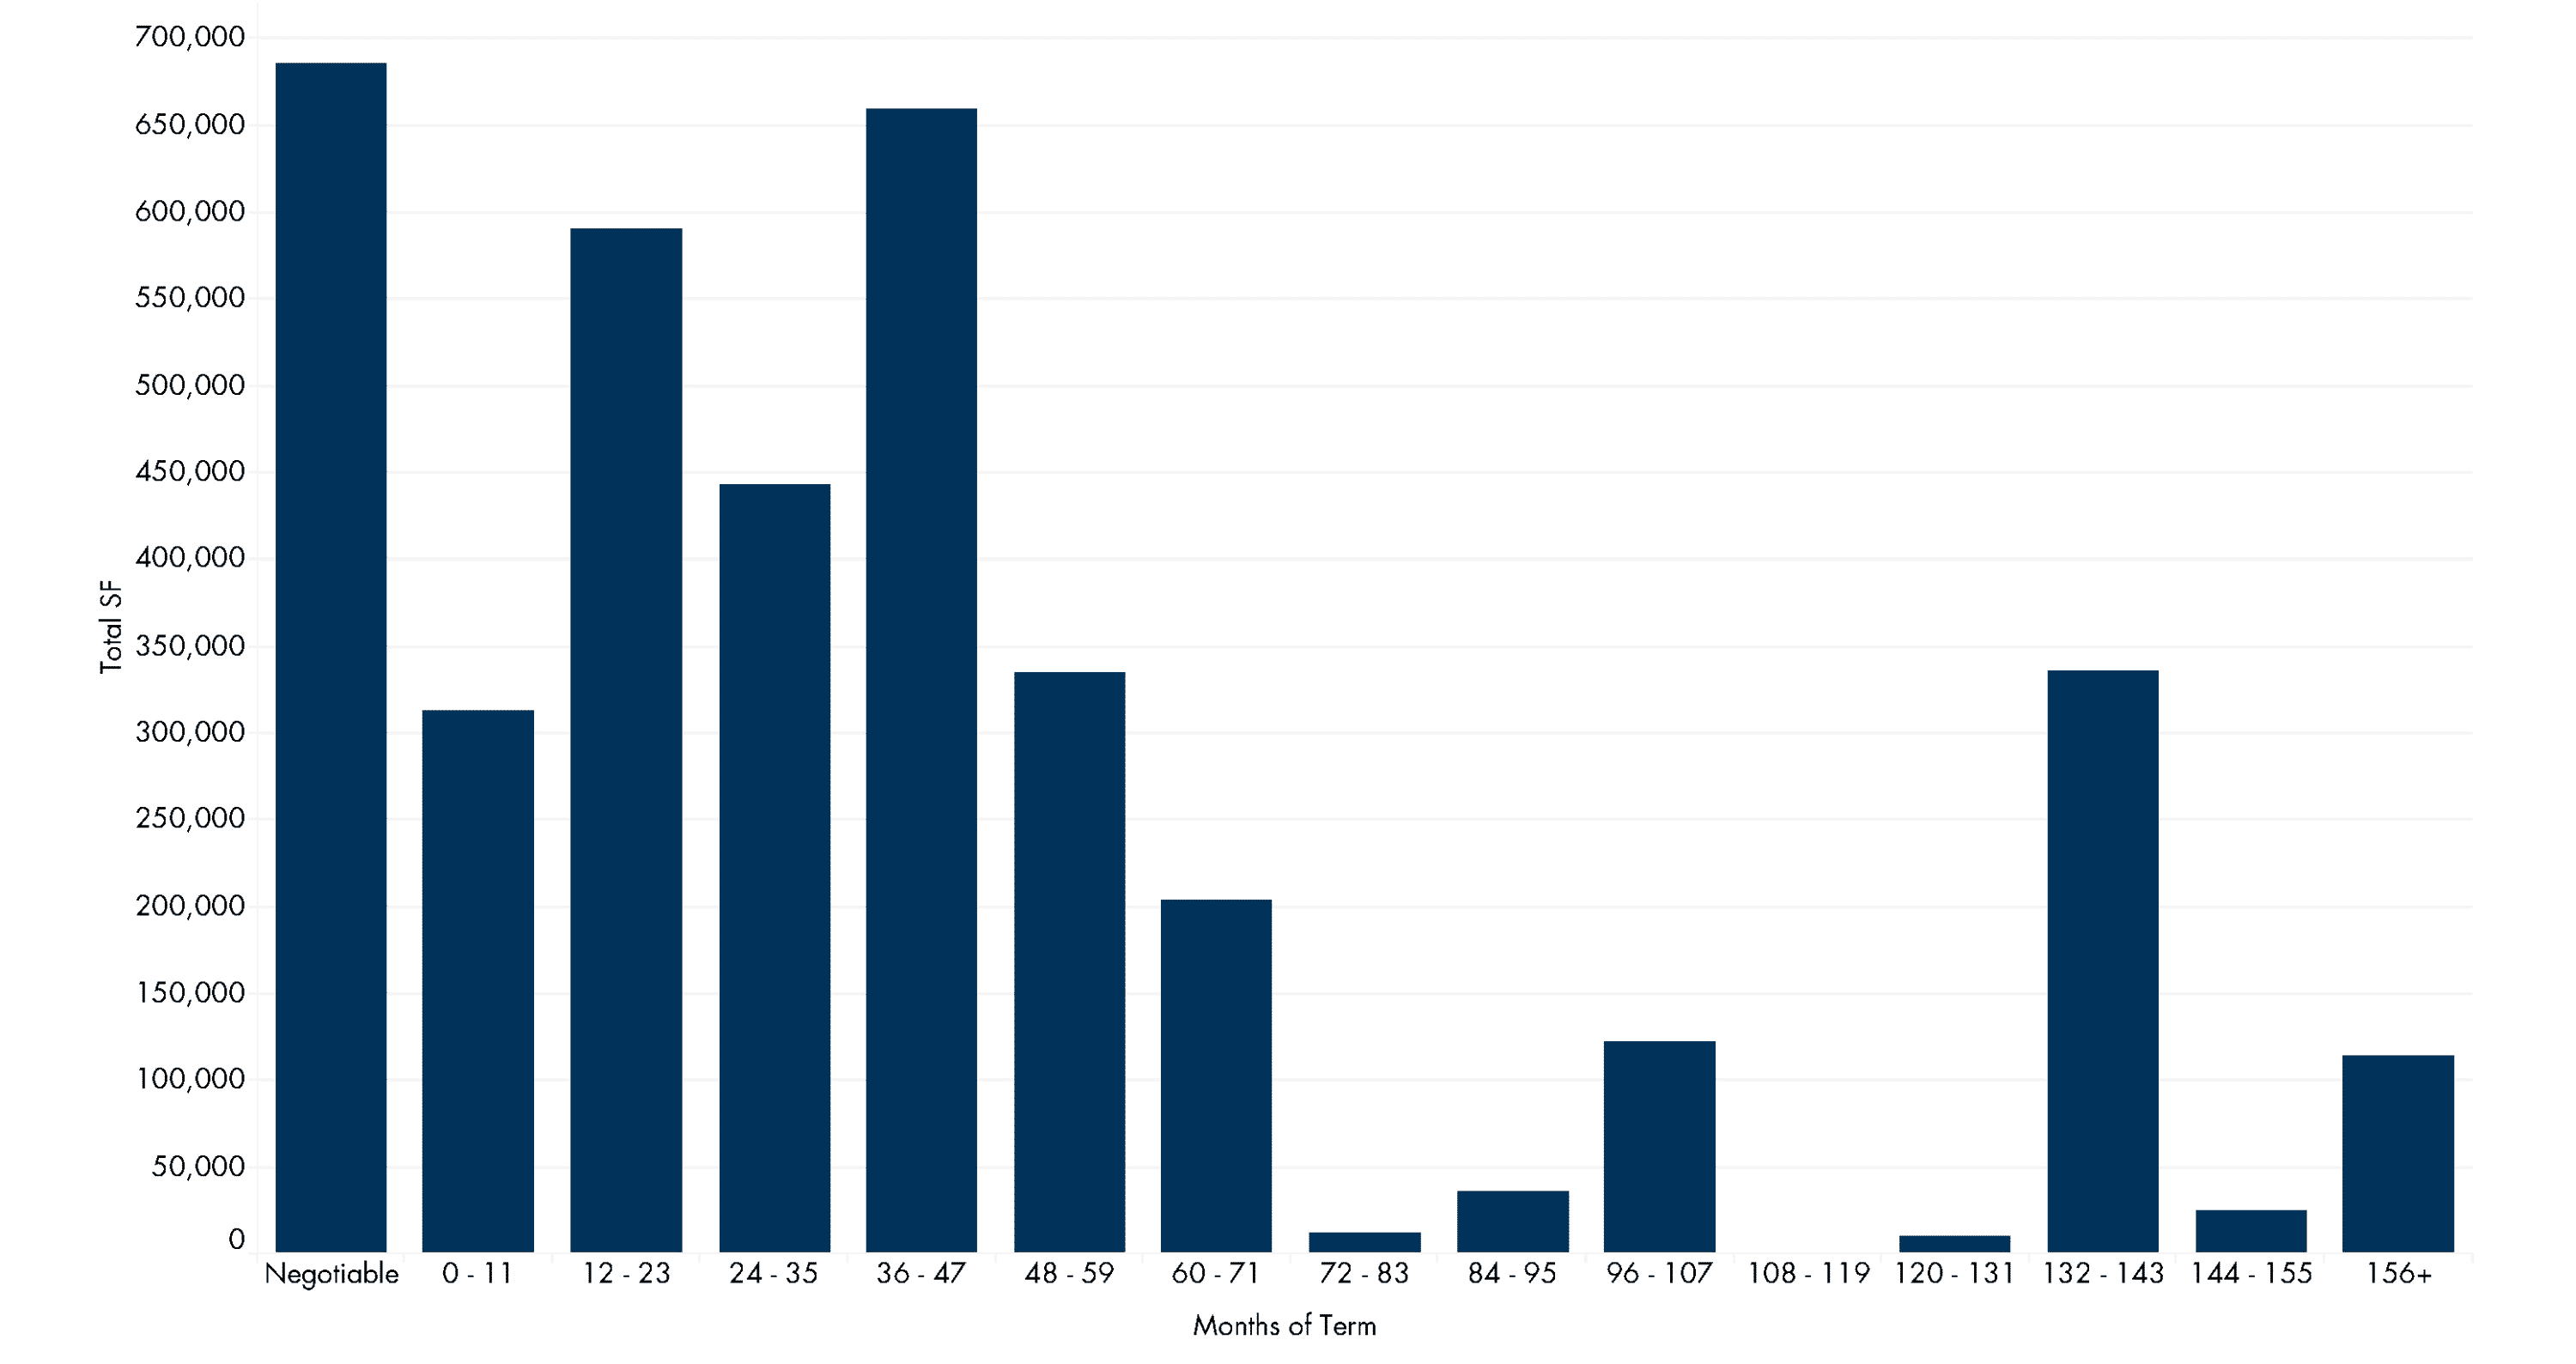
Without taking into account the spaces with a negotiable term, 72% of the currently available sublease space has at least two years remaining, while 13% has one year or less. As leasing volume begins to increase, it will be interesting to see how these longer-term subleases compete with landlords trying to lease space on a direct basis.
Read Next: How Much Does It Cost to Lease Office Space in Austin, Texas? (Rental Rates, Pricing)
What Are the Largest Subleases on Austin’s Office Sublease Market?
Now that we’ve looked at sublease volume on a citywide basis, let’s dig into the details and look at the largest subleases on the market today.
As of the end of 1Q 2021, the largest sublease available was Parsley Energy’s space at 300 Colorado. Delivered this quarter, 300 Colorado was previously known as Parsley Tower until news broke in late 2020 that Parsley had been purchased by Pioneer Natural Resources and would no longer be occupying the space. It’s unclear whether this availability will be broken into smaller leases or if a single tenant will lease the entire space. Rumors have circulated that companies like Facebook and others might be looking for additional space in Austin, though Facebook was recently reported to have walked away from negotiations for the space.
10 Largest Sublease Spaces in the Austin Office Market
| Building Name | Tenant | Submarket | Size (Square Feet) |
| 300 Colorado | Parsley Energy | CBD | 309,765 |
| 8900 Amberglen Blvd. | State Farm | Far Northwest | 124,147 |
| Domain 2 | Vrbo | Northwest | 114,665 |
| East 6 | GoDaddy | East | 114,417 |
| Indeed Tower | TRS | CBD | 100,774 |
| Domain 4 | Accruent | Northwest | 84,772 |
| 3900 San Clemente | VMware | Southwest | 77,496 |
| Austin Centre | Netspend | CBD | 68,279 |
| 501 Congress | Dropbox | CBD | 59,331 |
| Quarry Oaks 1 | Forcepoint | Northwest | 58,532 |
Notable subleases on this list, besides those already discussed, include:
- Vrbo – In February 2020, Expedia Group (the owner of Vrbo) announced that it would lay off 12% of its workforce as part of a plan to save the company between $300 to $500 million per year. Along with those layoffs the company also placed its space at Domain 2 on the sublease market. Vrbo recently moved some of its employees into Domain 11, a 16-story, 324,000-square-foot tower, but in April 2020 the company halted build-out on the second phase of the project due to COVID-19.
- GoDaddy – After moving into its newly constructed space at the end of 2019, GoDaddy listed the full building for sublease in July 2020. The company announced in June 2020 that it would be restructuring, reducing headcount, and closing two Austin offices.
- TRS – Some lawmakers and members of the public were not happy that TRS had leased roughly 100,000 square feet of office space at Indeed Tower in 2019, leading TRS to reverse course and list its full space on the sublease market in early 2020. As of this writing, the space is still available for sublease.
- State Farm – State Farm has confirmed that it will be closing its Austin office at 8900 Amberglen Boulevard due to COVID-19. The space is currently being offered for sublease and expires in 2028. The company does not have plans to occupy new space, and employees will continue to work remotely.
All together, these 10 spaces account for roughly a quarter of the total office sublease availability citywide.
Conclusion
Although this influx of sublease space into the Austin office market is something none of us would like to see, it is still an interesting phenomenon and is undoubtedly something all of us in the industry will look back on for years to come. As of this writing, it appears the Austin office market is recovering, sublease volume is leveling off and office tenants are once again looking to lease space. Let’s hope that trend continues through the remainder of 2021.
