


This article was originally published in AQUILA’s 4Q 2021 Austin Office Market Report. This article will not be updated, but please contact us if you have specific questions regarding the information in this article.
There is no denying the Austin market has made a name for itself in recent years. From soaring numbers of people moving here to companies wanting to set up shop, Austin is on just about everyone’s radar for one reason or another.
However, Austin isn’t the only city thriving recently and we began to wonder how other areas of the country compare.
Read Next: Two Ways Austin May Change in the Future
In this quarter’s special report, we take a look at how Austin compares to other major markets today across a variety of topics, including:
- Commercial real estate market
- Demographics
- Job market
- Which city is the next Austin?
Methodology
To do this analysis, we’ve limited our sample set to the 50 largest MSAs in the United States based on office inventory. These markets range from New York, with 1.2 billion square feet, to Norfolk, Virginia, with 55.3 million square feet.
Unless stated otherwise, the real estate data in this article was provided by CoStar, the demographics were provided by Esri and the job data was provided by Emsi. City names mentioned in this article are referencing the MSA, not strictly the city limits.
A table with the stats for each of the 50 MSAs in this study is provided at the end of this article.
Commercial Real Estate Market
To kick things off, let’s start with the simplest comparison: total office market size.
The New York MSA, which includes Newark and Jersey City, blows all other markets out of the water with its 1.2 billion square feet of inventory. Even Los Angeles, the second-largest market in our analysis, has less than half that space (590 million square feet). Austin currently has just under 122 million square feet of space, which puts it close to MSAs like Tampa (127 million square feet), San Diego (119 million square feet), and Charlotte (128 million square feet).
When it comes to market growth, Austin really shines. Austin currently has roughly 5.8% of its inventory under construction. The closest MSAs to Austin in this regard are San Jose at 5.7% and Seattle at 5%. However, those are the only markets with 5% or more of their inventory under construction. The majority of markets in this study fall at or below the 2% mark, with 22 of the 50 markets below 1%. Of course, 1% of growth in a large MSA might mean more physical square feet being developed than 4% growth in a smaller MSA, but it is notable that Austin stands nearly alone in terms of the high rate of growth it is experiencing.
Read Next: Austin vs. New York: Which Is Better for Your Business?
In terms of how these markets are performing, vacancy and net absorption rates paint a great picture. The Austin market has a relatively high vacancy rate compared to other markets, currently sitting at 13.4% as of this writing. Nine markets do have a higher overall vacancy rate, ranging from San Francisco (13.9%) to Houston (19.4%), but the majority of markets have a vacancy rate of 11% or less.
However, on the net absorption front, Austin’s performance is much better. Austin’s net absorption was 1.8 million square feet over the last 12 months, only being beat by Miami with 2.6 million square feet (although Austin ranks first in our data set for the percentage of absorption compared to market size). Other markets have not done nearly as well, with 33 of them having negative net absorption over the same time period.
Read Next: Tracking the Recovery of the Austin Office Market
Demographics
Moving on from the real estate markets themselves, let’s take a look at the people living in each of these areas and how they compare to the population of Austin.
In regards to total population size, Austin’s population falls right in the middle of our data set. With roughly 2.3 million residents in the MSA, Austin has a similar population as Sacramento and Pittsburgh (both roughly 2.3 million) and is close to larger markets like Tampa and Denver (both roughly 3 million). New York and Los Angeles are far and above most markets with well over 10 million residents each, while smaller markets like Albany, New York, and Stamford, Connecticut bring up the rear with fewer than 1 million residents.
Of course, the sheer volume of people living in an area doesn’t quite paint the full picture of how each of the markets in this study truly compares to Austin. To do that, we need to look at the demographic composition of these residents.
Read Next: How Expensive Is Office Space in California vs. Austin? (Average Rental Rates, Calculator)
In terms of age, Austin has the third youngest population in our sample set with a median age of 34.7. Only San Bernadino, California (34.3) and Salt Lake City, Utah (32.8) can claim a younger populace, while 41 of the MSAs have a median age over 35. Austin’s median age has trended upward since 2010’s value (32.6), which is not surprising considering every MSA in our dataset has had a median age increase of roughly two years over the same time period.
Educational attainment levels are another useful comparison to make between the markets in this study since it is a factor that employers often reference and consider for talent recruitment and retention. Austin again ranks in the top three in this regard, with 29.5% of its population 25 years and older having a bachelor’s degree. Austin is only outranked by Raleigh, North Carolina (30.1%) and San Francisco, California (30.5%). That said, the majority of MSAs in this data set have 20% or more of the population with a bachelor’s degree, so the differences in this regard are minimal.
Austin has been painted as a haven for young professionals looking for a fun place to pursue their careers and earn a decent income, and the demographics definitely seem to confirm that to be the case.
Job Market
Market size and demographic stats are considerable data points for comparing metros, but a telling factor of any municipality is the job market.
Using data provided by Emsi and Esri, we looked at a variety of job-related factors across each of the 50 MSAs in this analysis. For starters, let’s take a look at the unemployment rate in each MSA over the course of 2021.
Unemployment Rates Comparison
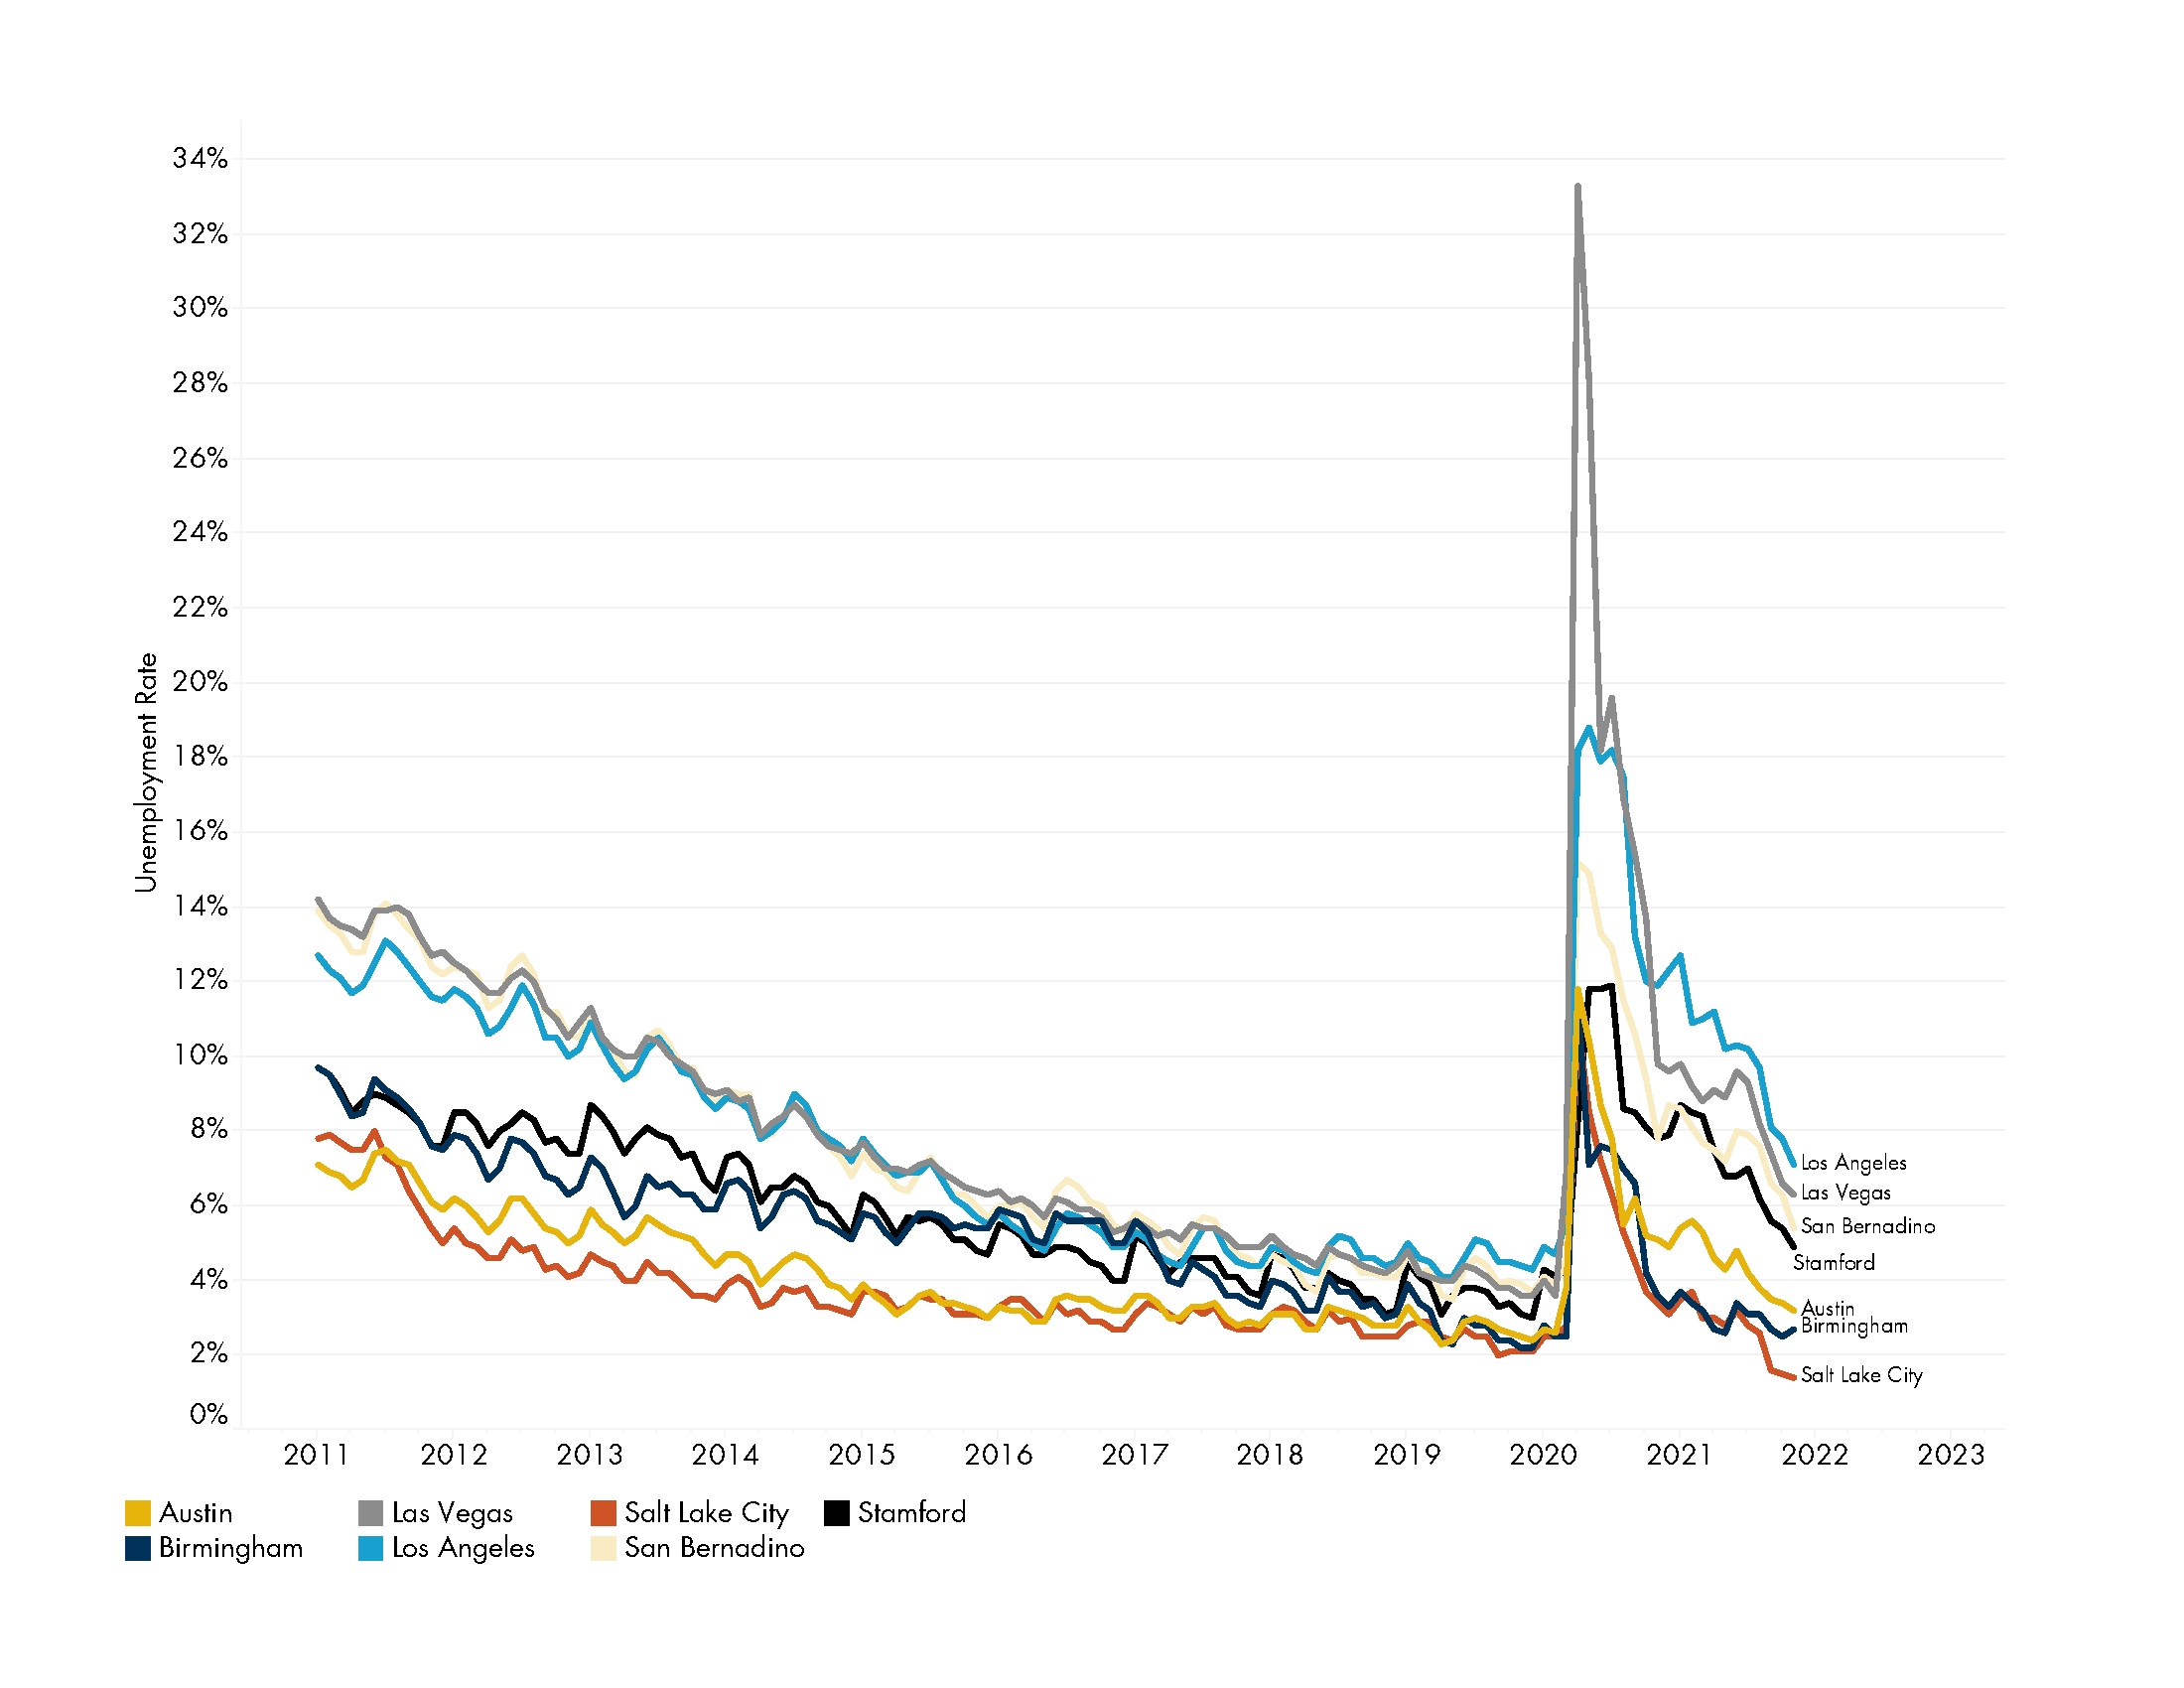
According to Esri, Austin’s unemployment rate over the course of 2021 was 4.8%. Not the best Austin has ever seen, but also not the worst considering what has taken place over the last two years. Twelve MSAs from our data set did better than Austin from an unemployment perspective, ranging from Birmingham, Alabama with 4.6% to Salt Lake City, Utah with 3.4%. While Austin may not have the best unemployment rate in the country, it did fare better than a majority of MSAs. Of the 50 MSAs we analyzed, 35 had an unemployment rate greater than 5% and four had a rate greater than 9% (Stamford, San Bernadino, Las Vegas, and Los Angeles).
But what about job growth in each MSA? After all, can’t unemployment rates be contributed more to COVID-19 than anything else? We’ve addressed these two questions with the help of job postings and industry data.
Job Posting Volume

Across all 50 MSAs in our data set, there were 3.5 million unique, full-time job postings in December 2021. As you would expect, the volume of postings was greatest in the MSAs with the largest population (New York, Los Angeles, DFW, etc) and least in the MSAs with the smallest population (Birmingham, Stamford, Albany, etc).
To give a better comparison we can calculate the job postings per person, which puts each MSA on an even playing field. By doing this, we can see that the MSA with the most job postings per person is Denver with 0.036. Austin comes in second with 0.029, followed closely by MSAs like San Francisco, DFW and Nashville (all roughly 0.028). While the concentration of job postings doesn’t necessarily have a direct correlation to how strong a job market is or how likely it is to grow in the near future, it’s a good start for understanding where employers are most active today.
Read Next: Why Austin, Texas is a Best Place to Live & Work (as Ranked in US News, Wall Street Journal)
In addition to the current volume of job postings, we also looked at how the volume of postings has changed over time across the MSAs in our data set. Between December 2019 and December 2021, total unique, full-time job postings in Austin increased by 89%. This puts Austin in a similar ranking as Minneapolis (91%) and Richmond (88%). Hartford, Connecticut ranked at the top of this list with 128% growth over this time period, while Washington D.C. ranked at the bottom with only 27% growth.
It’s tough to have a strong MSA without a strong job market to support it, so keeping an eye on these factors is as good a way as any to gain a high-level understanding of how these markets compare.
Which City Is the Next Austin?
Talk about the million-dollar question. Investors, residents, employers, and government officials alike are all wondering which MSA is set to experience the same level of growth that Austin has seen over the last decade.
So, which city is it?
With such a complicated and important question, there are a number of ways to answer it. Want to know which MSAs have a similar population today as Austin did ten years ago (1.7 million)? That’s Norfolk, Virginia (1.8 million) and Providence, Rhode Island (1.6 million). Want to know which markets have a similar office market size as Austin in 2010 (96.7 million square feet)? That’s Nashville (100 million square feet) and San Antonio (86.6 million square feet). What about MSAs that are forecasted to grow their population at an annual rate similar to what Austin has achieved since 2010 (roughly 3% per year)? Esri estimates those markets to be Raleigh, North Carolina (2.07% per year) and Orlando, Florida (1.94% per year). And what about qualitative factors like quality of life, governmental factors, and even the weather? Don’t get us started.
There are so many ways to answer this complicated question that we couldn’t find the space to fit it all in this article. Stay tuned for more on this important topic.
Conclusion
So, how does Austin compare to other major markets across a variety of variables? In short, fairly well. Out of all the factors we compared and the MSAs we analyzed, Austin ranked near the top of the list for the positive factors and near the bottom of the list for the negative ones. Overall, Austin appears to stand up to the hype.
However, the true takeaway from this analysis is how many U.S. markets are performing exceedingly well despite the challenges of COVID-19 and the changing view of the workplace over the past couple of years. We’re excited to see if this trend continues in 2022.
Click to download PDF of table: “Comparison of Top 50 MSAs in U.S. by Office Market Size.”


