Wondering how Austin’s economic and CRE fundamentals are performing?

Recent micro and macroeconomic trends have left many of us wondering what the present and future hold for Austin. We have compiled – and will continue to update –  this dashboard to help navigate our city’s office market.

Specifically, you will find a collection of relevant data points that should help paint a picture of how Austin’s economy, the U.S. economy and Austin’s CRE market are performing.


Want the latest from the AQUILA Learning Center?

We’ll send you one email a month featuring our best content from the month before.


About the Author

Chloe Stavinoha

Chloe is a market research analyst on AQUILA’s market research team.
Chapter 1

Austin's Commercial Real Estate Market

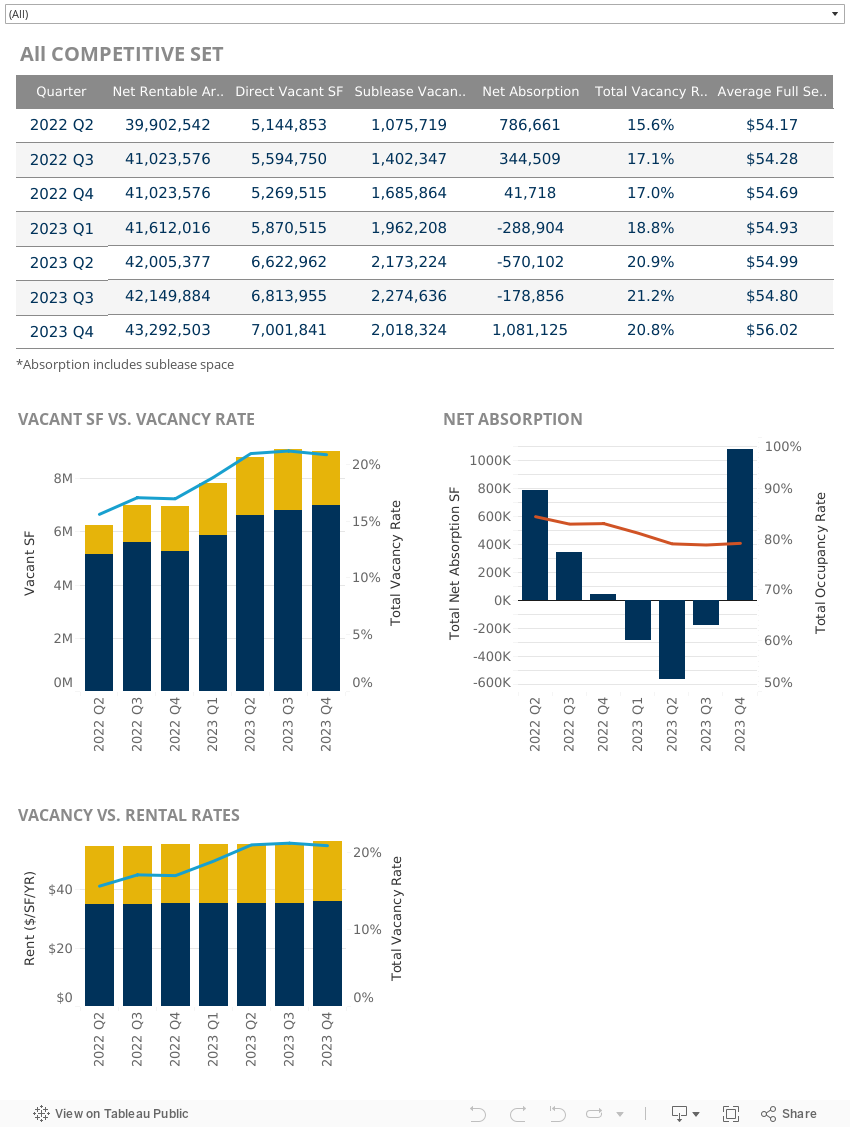
Quarterly Office Report Stats

Below you will our most recent quarterly office market stats, the same stats used in our most recent quarterly report. Use the filters at the top to view different submarkets.
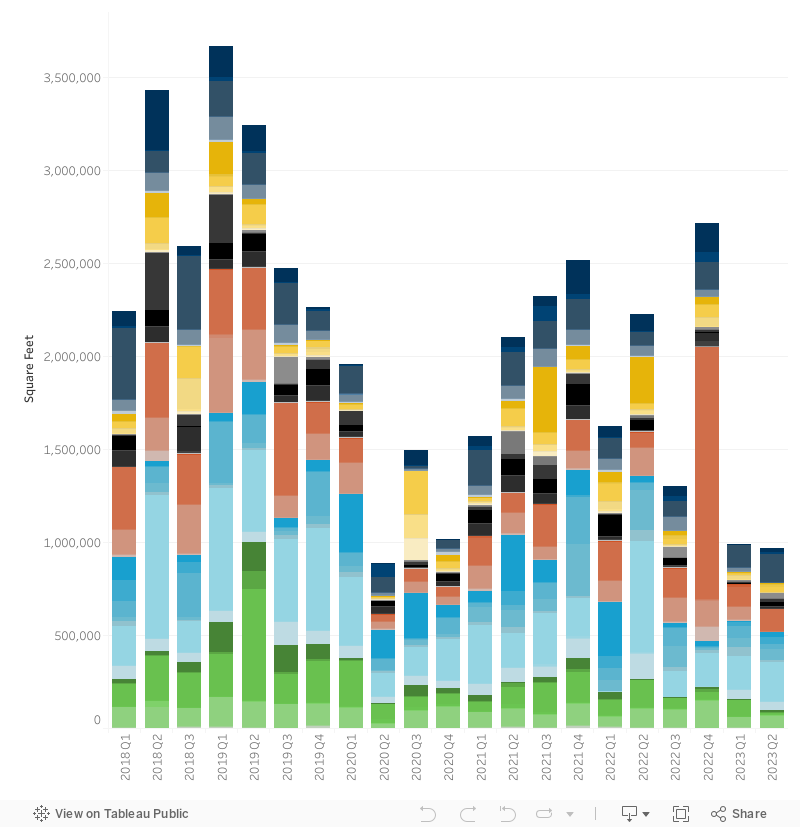


Leasing Volume

Utilizing CoStar’s leasing data, we can see how office leasing volume has changed over the past few years. We have also segmented the data by building class and age to paint a better picture of where leasing volume is highest.
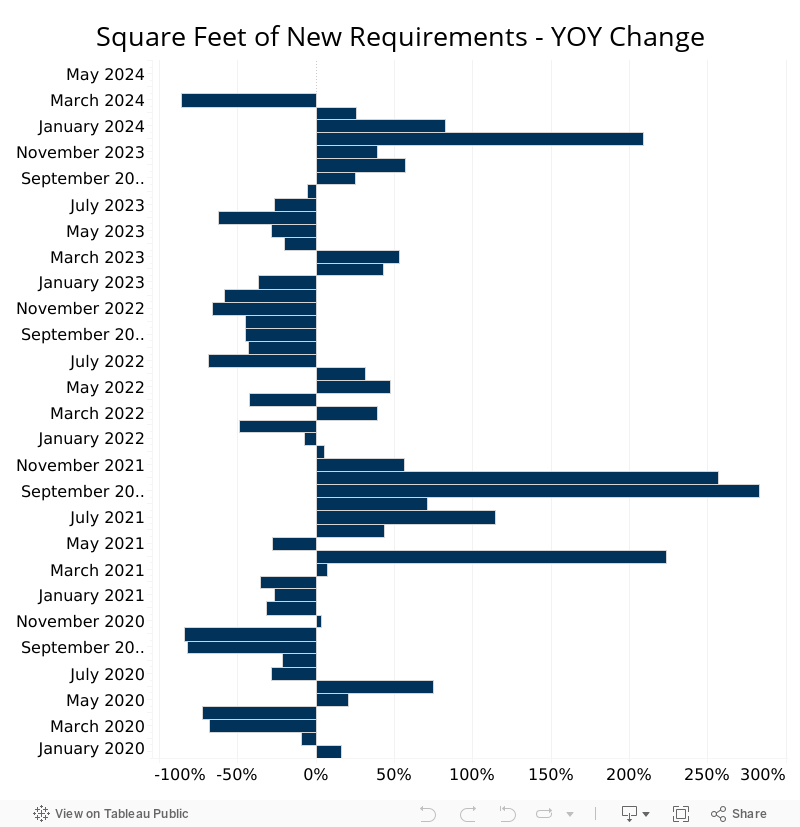
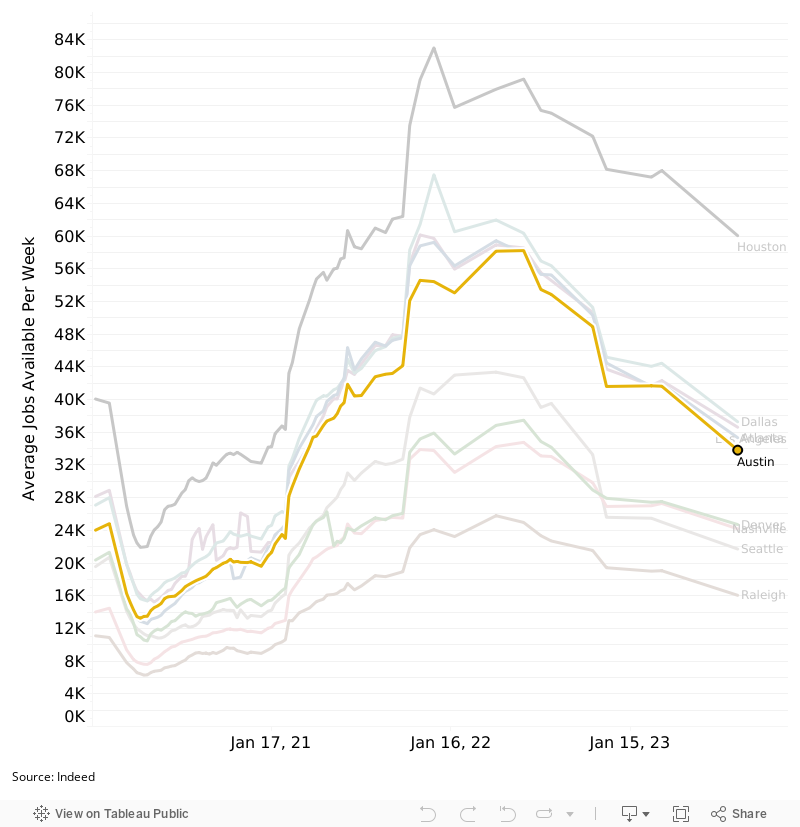


Deals in the Market

Using AQUILA’s proprietary data on tenants actively searching for space in the Austin market, we are tracking the square feet of requirements per month. These numbers include all tenant types looking for office space in Austin. The chart shows the percentage difference in requirements compared to the same month a year ago.


Impact of Term and Size on Net Effective Rate

Using lease comps executed between 2019 to 2023, we can see how lease size and term can impact net effective rates. We’ve broken leases into quartiles, with the first quartile being the least expensive comps in our dataset and the fourth quartile being the most expensive. The primary takeaway from this data is that duration and size of lease transactions can have a notable impact on net effective rates depending on which quartile a transaction falls under.

Net Effective Base Rate Quartiles Contribution per Year of Term
1st Quartile  $0.09
2nd Quartile  $(0.03)
3rd Quartile  $(0.01)
4th Quartile  $0.00
Net Effective Base Rate Quartiles Contribution per 1,000 SF
1st Quartile  $(0.04)
2nd Quartile  $(0.07)
3rd Quartile  $(0.06)
4th Quartile  $(0.47)


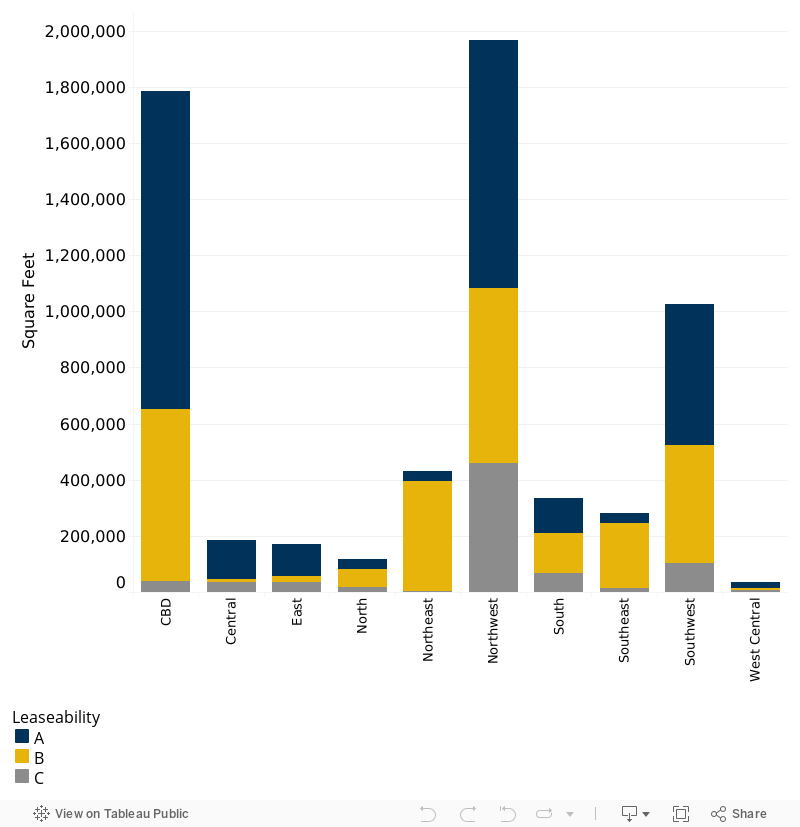
Transaction Volume by Size

The table below shows how transaction volume in Austin has changed based on the size of deals being signed. Transactions in the 0-to-10,000-square-foot range continue to make up a larger portion of total transaction volume than they have in previous years.

Last 180 Days 2023 2022 2021 2020
0-10,000 51% 49% 41% 42% 43%
10,001-30,000 18% 22% 28% 28% 25%
30,001+ 32% 27% 31% 30% 32%


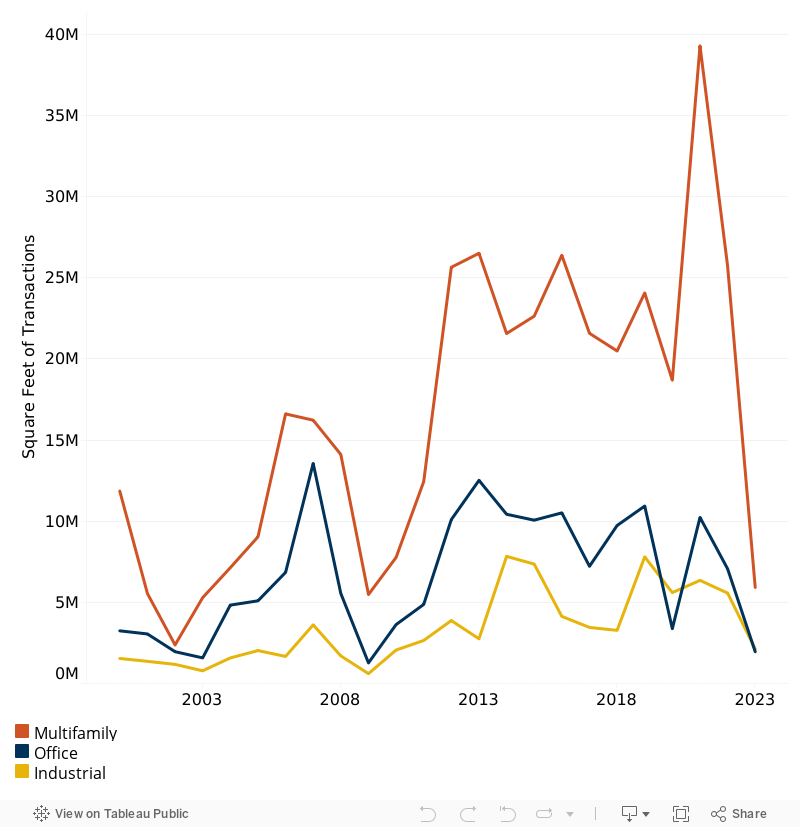
Sale Transaction Volume

Using CoStar data, we can see how transaction volume (total square feet) has varied over the years in the Austin market.


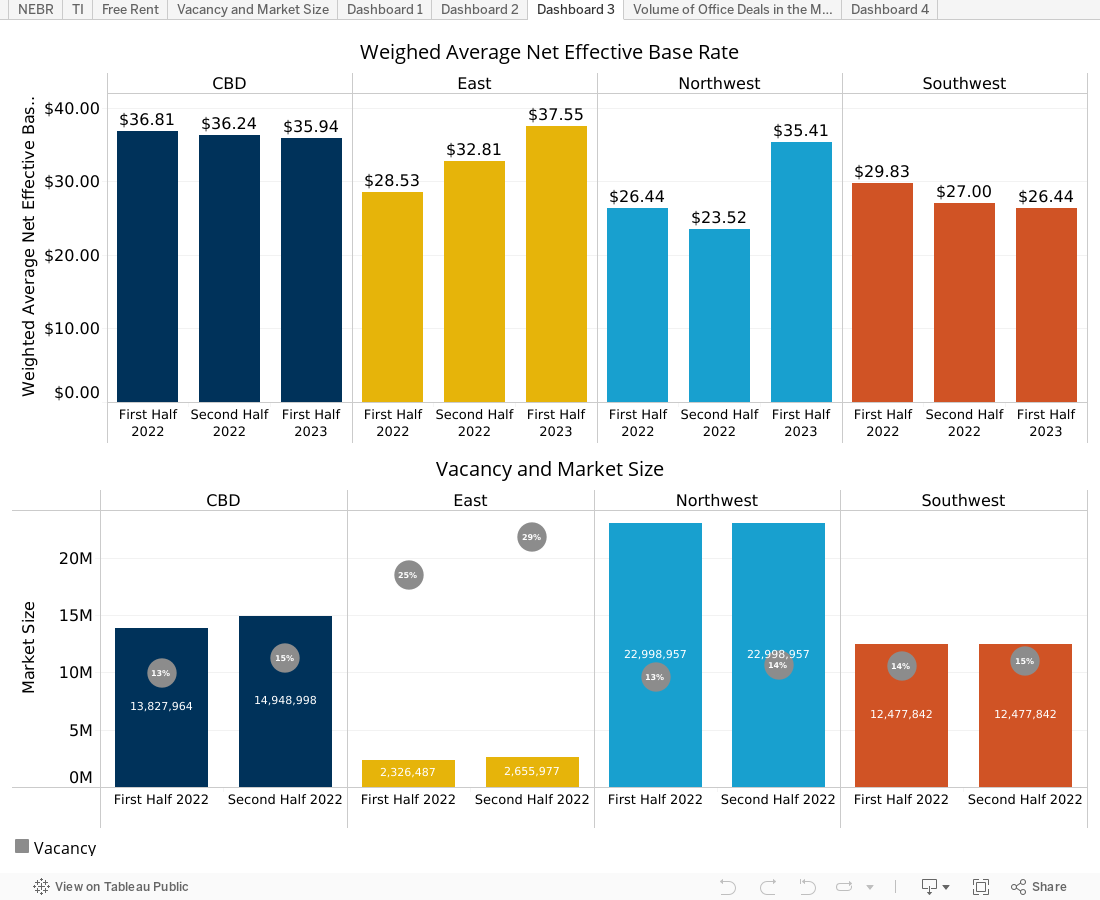
Early vs. Late 2022 Deals

AQUILA’s proprietary database of lease comps allows us to analyze transactions across Austin in a variety of ways. The below chart shows how transactions varied between the first half of 2022 and the second half. As you can see, the second half of the year tended to see deals executed at a lower net effective rate, with the exception of deals in the East submarket.


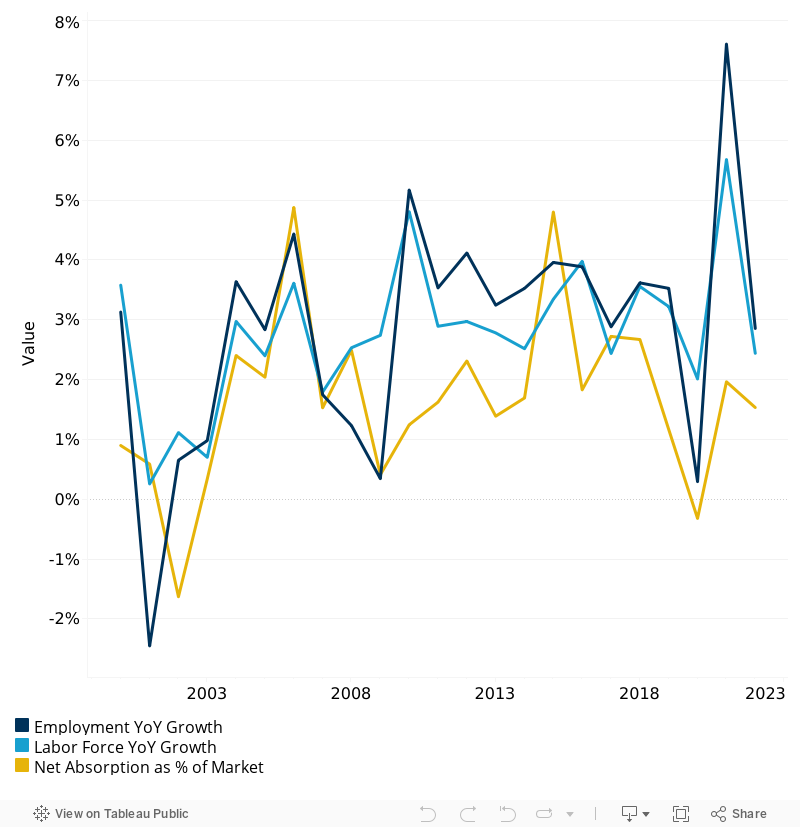
Population Growth vs. Net Absorption

The chart below shows how population, employment, and office net absorption have changed over time in the Austin MSA. Please note that these data points end in 2022


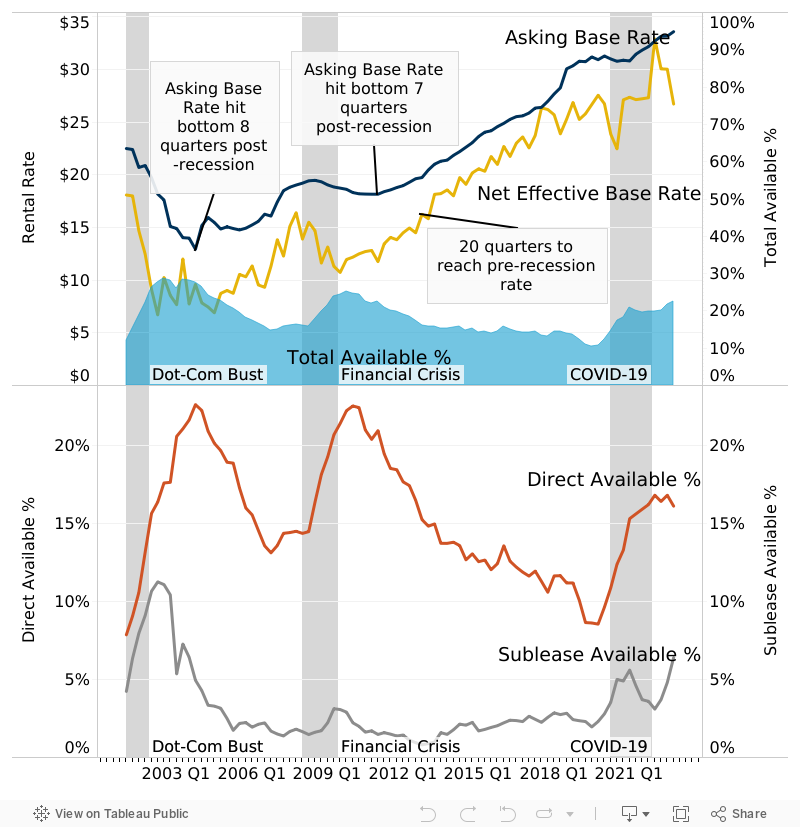
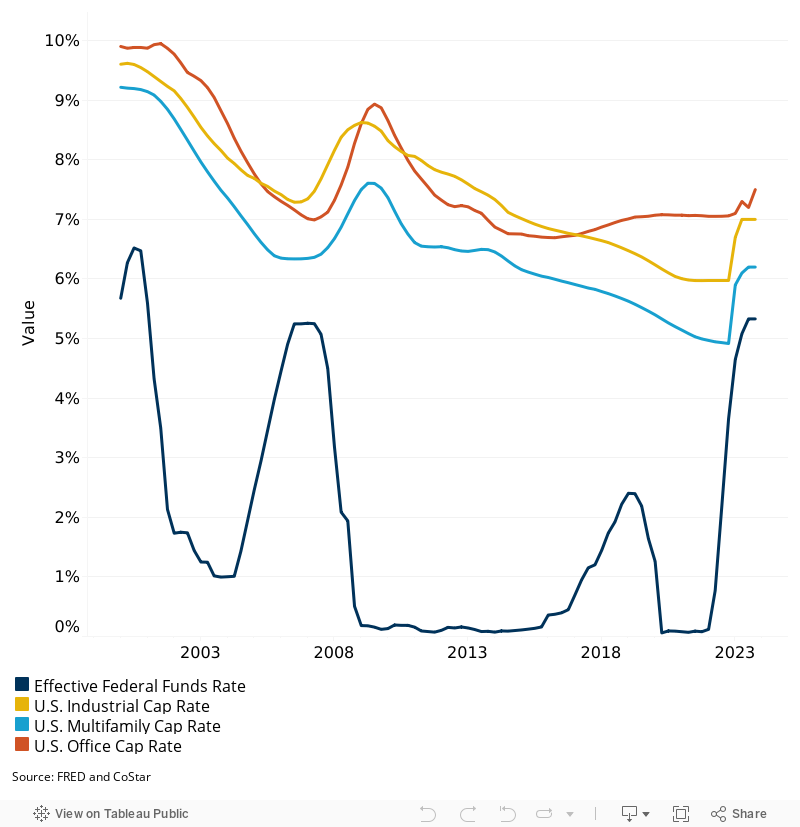
Net Effective vs Quoted Base Rates

The below chart shows how the delta between net effective and quoted base rates have changed in the Austin office market over time.


Chapter 2

Sublease Market

Office Sublease Leasability

While the volume of sublease space in Austin has increased significantly in recent years, not all spaces are created equal. In the chart below we’ve segmented Austin’s sublease market based on the “leasability” of the space. Spaces rated as “A” are the most sought-after, with each subsequent rating being of lesser quality. Leasability is based on several factors, including but not limited to, size, location, availability of furniture, and quality of space/building. This is in accordance with current market factors and trends associated with the types of spaces currently receiving more demand and activity from tenants in the market as well as opinions from local brokerage representatives. 


Chapter 3

Austin’s Economy

Unemployment Rate

Though unemployment in the Austin area peaked at over 12% in early 2020, it has now decreased to pre-pandemic levels.


Housing Market Stats

Austin’s housing market is booming, with homes selling for thousands over asking price and inventory at an all-time low. The numbers below represent the most recent monthly stats on the residential market’s performance.

$450,000

Median Price

2,563

Closed Sales

4,714

New Listings

3,116

Pending Sales

3.8

Months of Inventory

Source: Austin Board of Realtors – March 2024 Central Texas Housing Market Report


Housing Permits

Another important statistic to review in conjunction with housing sales is housing construction. The below chart tracks the number of housing permits issued in the Austin MSA on a monthly basis.


Austin Business Cycle

The Austin Business-Cycle Index is put together by the Federal Bank of Dallas for the purpose of gauging the current state of the economy. The index takes into account unemployment, wages, employment and retail sales. 


Office Occupation Data

50.1%

10 City Average Occupancy

66.4%

Austin Occupancy

Source: Kastle Systems

Chapter 4

U.S. Economy

Inflation

We all know inflation has become a real concern in today’s economy, with businesses and individuals alike feeling its effects. The below data shows the YOY change in inflation according to the CPI.


Job Postings

Using job listings on Indeed, we have been tracking jobs available in Austin and comparable cities since the beginning of 2020. Most employers halted hiring at the onset of COVID-19, so this data can be used to gauge in which cities employers are starting to hire once again.


Effective Federal Funds Rate

With the Federal Reserve continuing to increase its target for the federal funds rate, this benchmark is becoming an increasingly important statistic to follow. Below you will find where the effective funds rate sits today and where it was previously. Also included are average cap rates for office, industrial, and multifamily properties in the United States.


We are here for you and are ready to help.

At AQUILA, we have always strived to not just be your real estate service provider, but your trusted partner and advisor as well. Know that we are here as a resource for you and are ready to help however you may need. Please don’t hesitate to reach out to your contact at AQUILA should you have any questions on any of the information provided.