
Wondering how Austin’s multifamily market is performing?
Multifamily real estate has become a popular topic in recent years, especially following the onset of the COVID-19 pandemic.
As part of our ongoing effort to be the best source for market research in the Austin commercial real estate market, we have compiled the below interactive chart to showcase today’s most relevant multifamily market statistics.
Use the chart below to toggle between variables and see how the most notable multifamily markets in the United States Compare. Below the chart, we have provided methodologies and explanations for each variable. These calculations are an estimation, please contact us with any specific questions.
Methodology
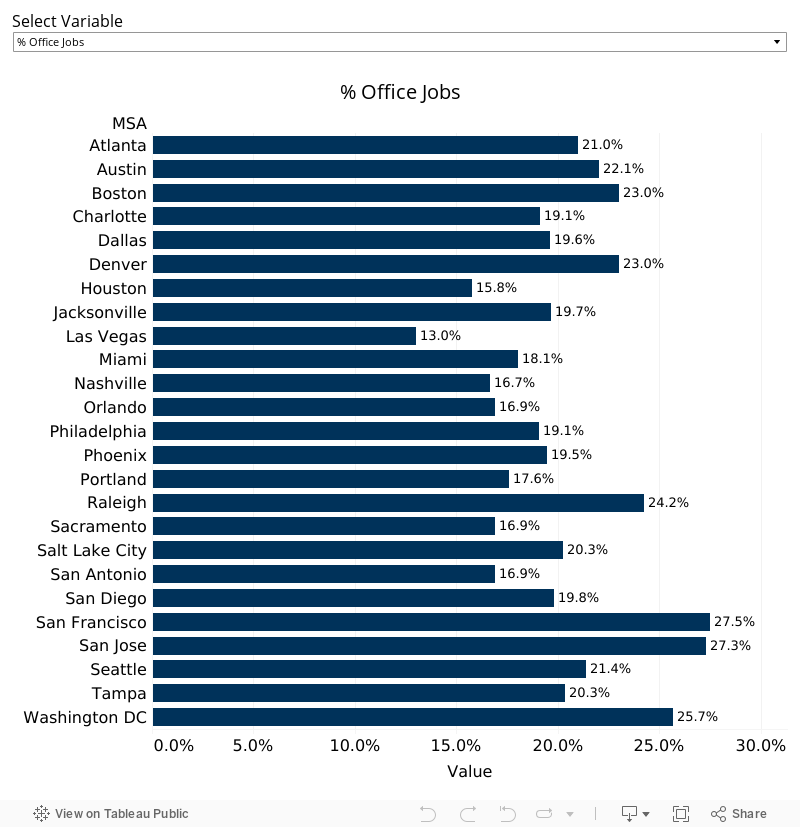
% Office Jobs
The volume of office jobs as a percentage of total jobs in each MSA. Office Jobs were defined as:
- Information
- Finance & Insurance
- Real Estate & Rental & Leasing
- Professional & Scientific & Technical Services
- Management of Companies & Enterprises
Educational Attainment
The percentage of the population in each MSA with a Bachelor’s degree or greater.
Household Income 2-Year Growth
The total growth on a percentage basis of median household income in each MSA
Office Job % 2-Year Growth
The total change on a percentage basis of office jobs in each MSA over the past 2 years.
Population 2-Year Growth
Population growth on a percentage basis for each MSA over the last 2 years.
Rent 10-Year Growth
The total growth of average asking rental rates for each MSA over the last 10 years.
Rent Affordability
Chunk rent versus median family income.
Rent Affordability 2-Year % Change
The percentage change in rent affordability over the last 2 years.
Rent to Buy
The cost to own (mortgage + taxes) versus average asking rents
Vacancy 10-Year Average
The average vacancy rate over the last 10 years for each MSA.