This article was originally published in AQUILA’s 1Q 2022 Austin Office Market Report. This article will not be updated, but please contact us if you have specific questions regarding the information in this article.
In the commercial real estate world, asking rental rates are an often-cited statistic. Quarterly market reports reference asking rates to track market performance, brokers publish asking rates in marketing materials for available spaces, and news sources compare asking rates in one city versus another to showcase differences in affordability.
While asking rental rates are a useful indicator when analyzing a commercial real estate market like Austin, they only tell part of the story.
Another important part of the story is the concessions and escalations given to tenants when leases are signed and the impact they have on net effective rates.
To highlight their importance, in this quarter’s special report we have used AQUILA’s database of office lease comps to dig into the subject, including:
- What are lease concessions, escalations, and net effective rates?
- How free rent has changed
- Types and prevalence of escalations
- Analyzing tenant improvement allowances
- Changes in net effective base rates
What Are Lease Concessions, Escalations, and Net Effective Rates?
Before we dig too far into the data, let’s take a moment to define exactly what we mean by lease concessions, escalations, and net effective rates.
Lease concessions are terms negotiated into a leasing agreement that are generally seen as a benefit to the tenant. Concessions, like free rent and tenant improvement allowances, are used by landlords to “sweeten the deal” for tenants and make the lease more attractive. Concessions can also be used as a competitive advantage, with better concessions occasionally being the deciding factor in a tenant’s search for office space.
While not a concession in the traditional sense, we’ve also included rent escalations in this analysis as it is another variable at play that has an impact on net effective rates. Escalations, whether they are on a percentage basis or an amount basis, are used by landlords to increase a tenant’s rent over the term of the lease. Landlords use escalations in an effort to maintain market-level rents rather than being locked into a lower rent for a longer term.
Combining the rental rate, concessions and escalations lead us to the net effective base rate (NEBR). In essence, the NEBR is the true financial value of the lease (on a square foot per year basis) over the entire lease term, taking into account escalations, free rent, and tenant improvement allowances. The NEBR gives us the ability to make an apples-to-apples comparison of lease transactions, and the delta between the asking base rate and NEBR shows us how much a lease is discounted through the negotiation process.
For the purposes of this analysis, we have used data for office space transactions in the Austin market executed between 2012 and 2021.
How Free Rent Has Changed
Free rent is a common concession used in Austin office leases, especially when it comes to new transactions. In fact, the absence of free rent in a lease comp is one of several red flags in our data validation process that requires us to dig further.
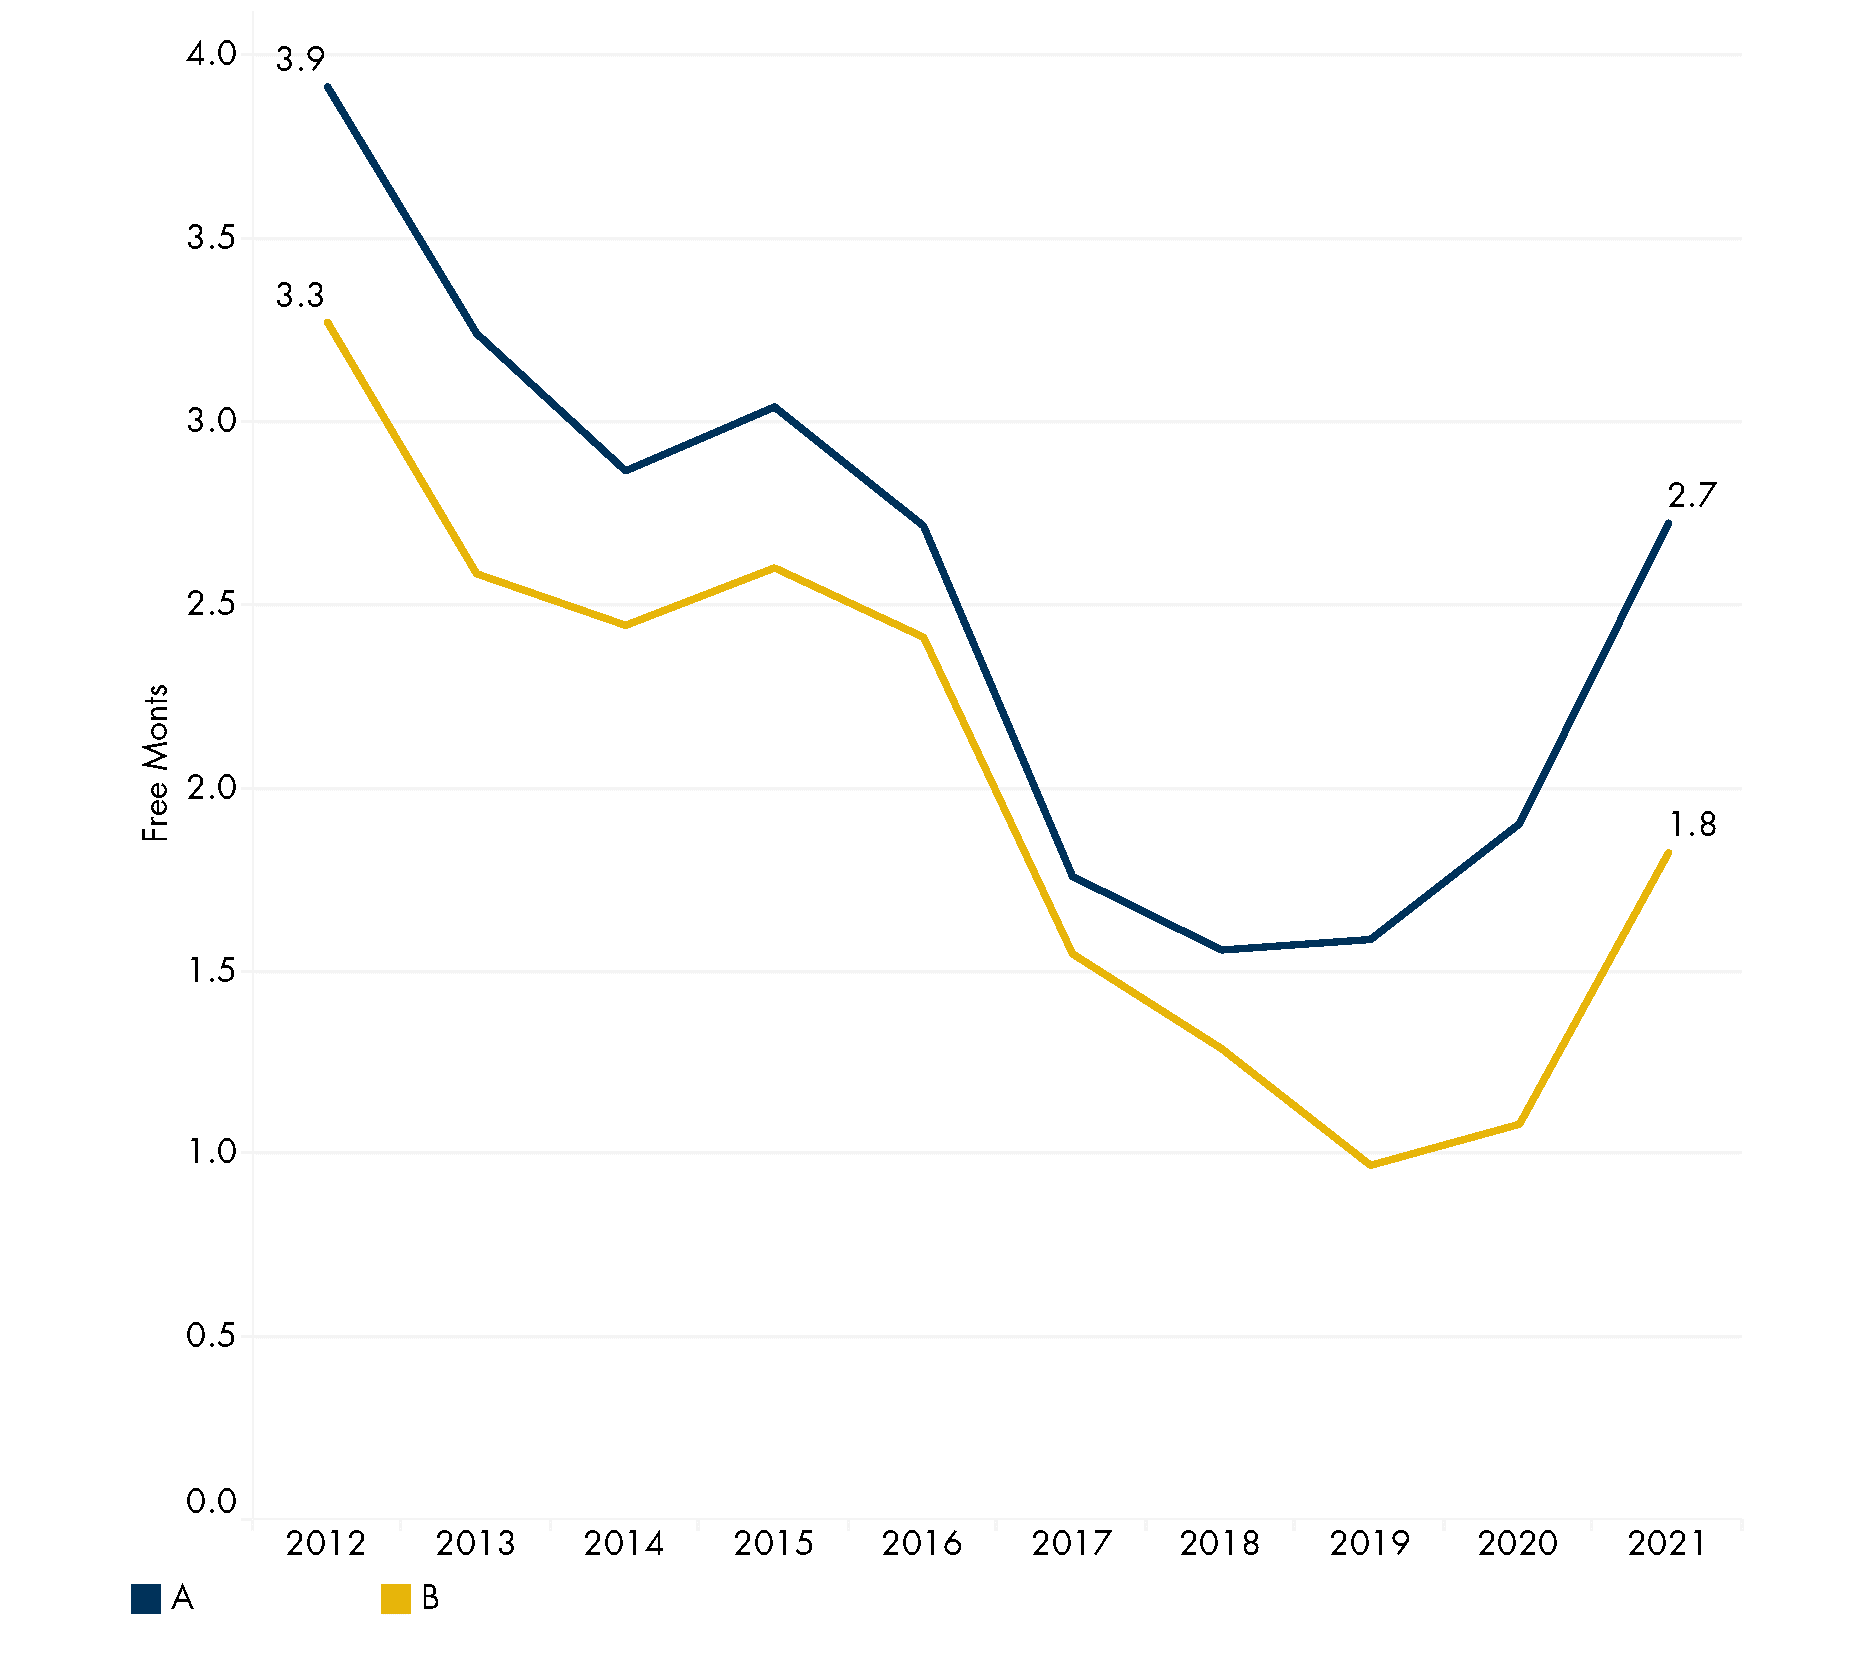
However, free rent’s popularity has been on a downward trend. Decreasing from an average of 3.9 months for Class A space in 2012 to a low of 1.6 months in 2018, landlords had been offering fewer and fewer free months to tenants. Starting in 2020, however, free rent began increasing once again. Now sitting at an average of 2.7 months for Class A space and 1.8 months for Class B, free rent has started to make a comeback.
Average Months of Free Rent by Building Class
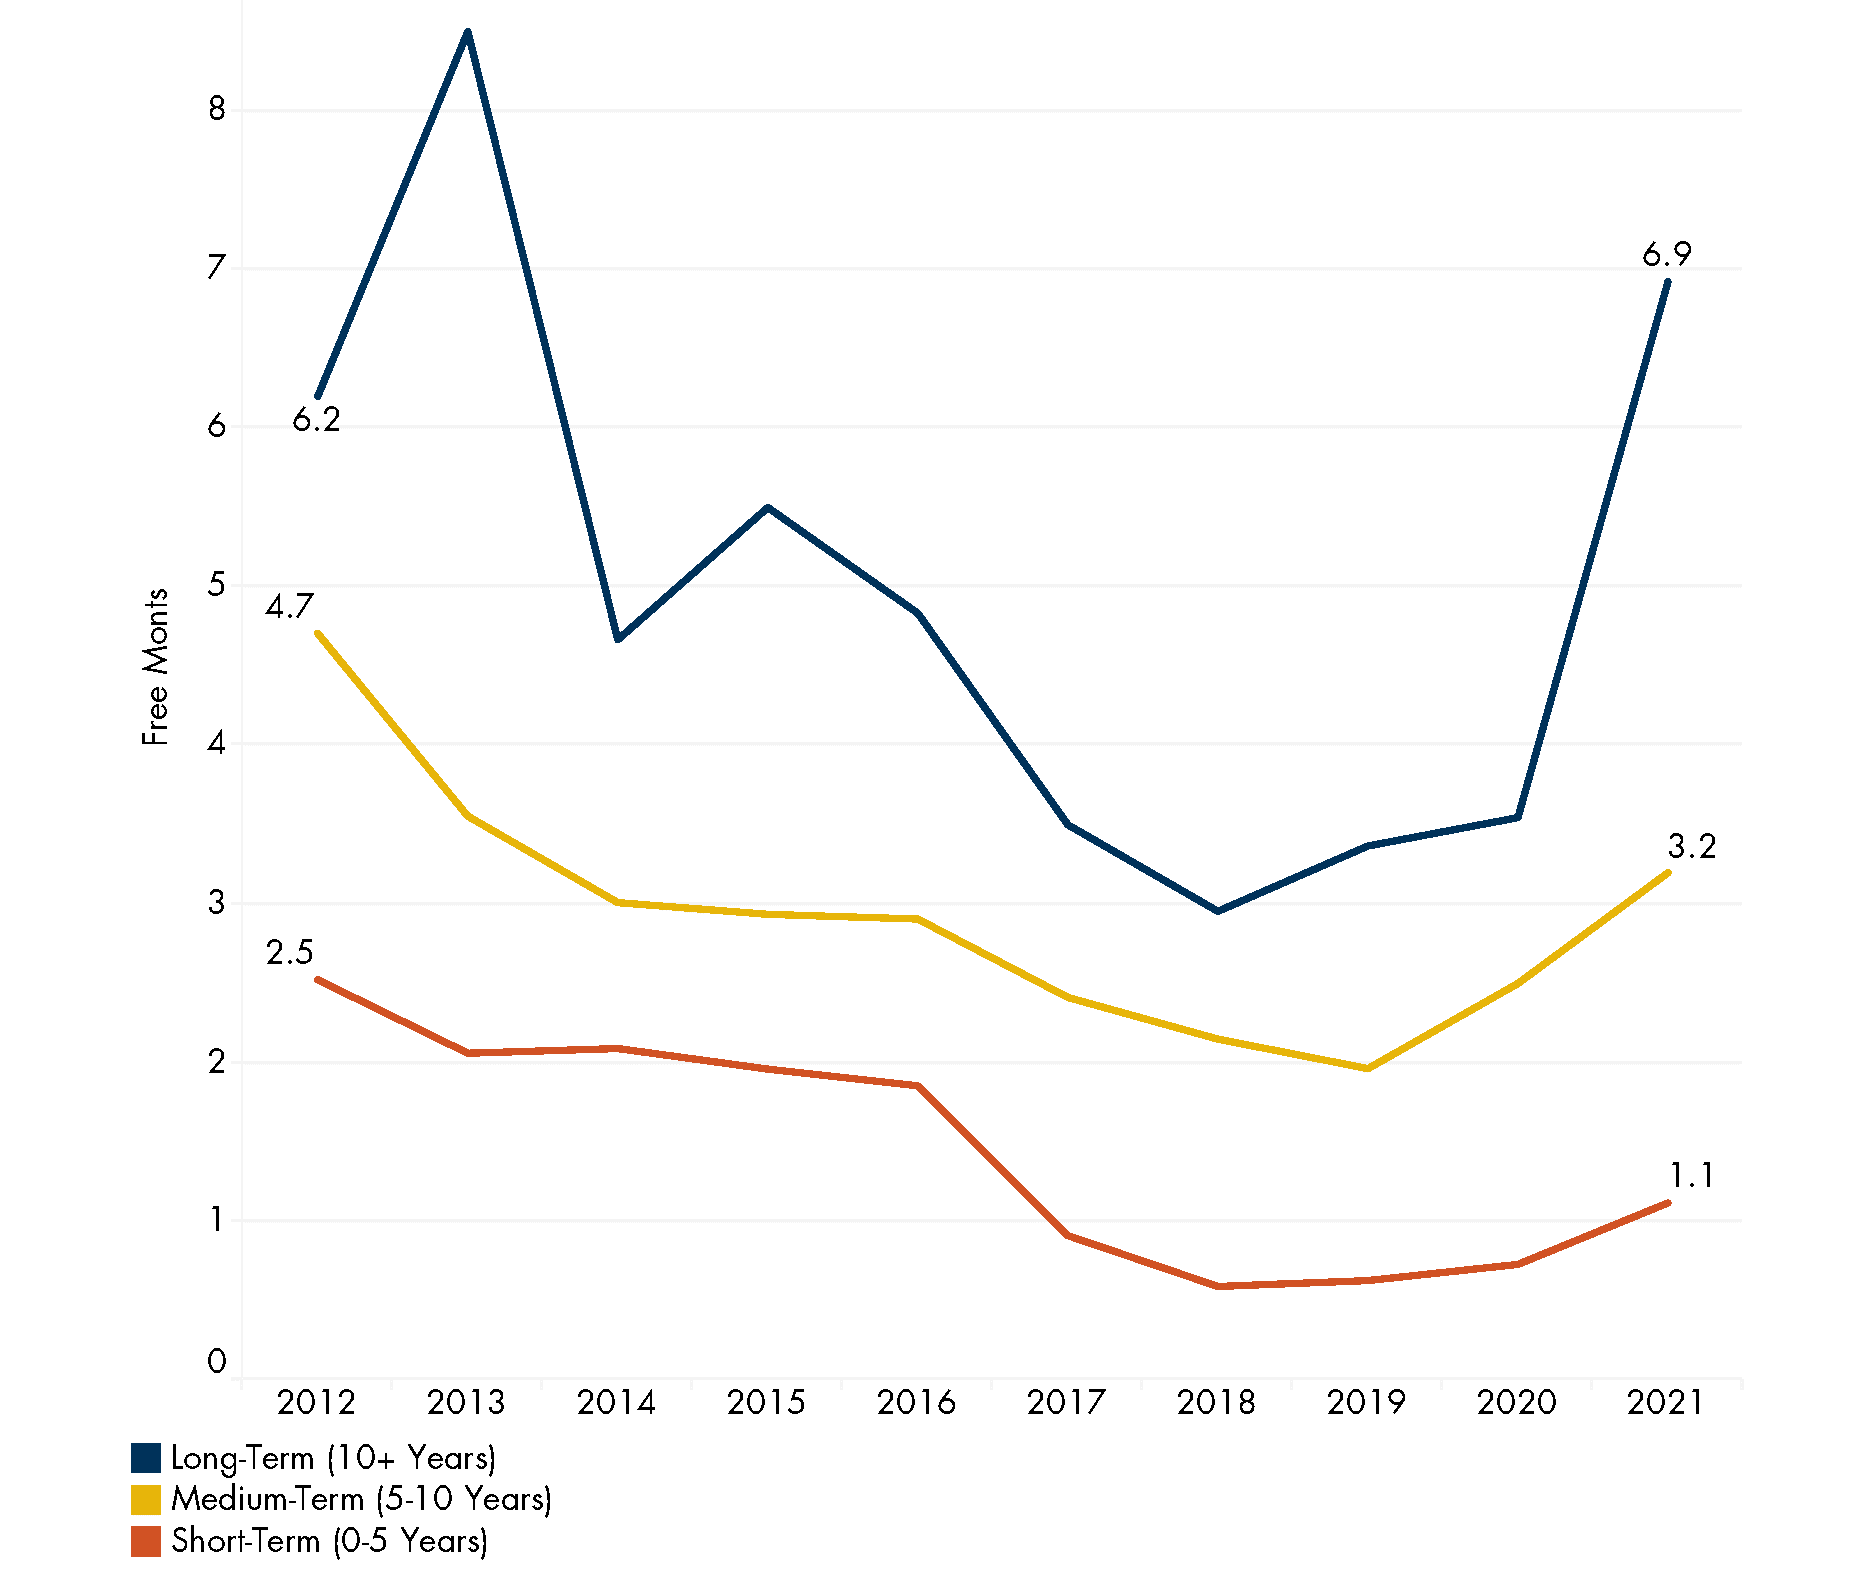
Free rent also varies significantly depending on the term of the lease. This correlation between months of free rent and months of lease term makes sense because a landlord wouldn’t want to give six months of free rent on a 12-month lease, but would probably be fine with doing so on a 10-year lease.
In the chart below, you can see how average free rent varies by lease term. As expected, long-term leases receive the most free rent while medium and short-term receive less. Though the correlation isn’t perfect, the data suggest that one month of lease term is equal to roughly 0.03 months of free rent.
Average Months of Free Rent by Lease Term
Types and Prevalence of Escalations
Escalations are another tool used in office leases to give more flexibility in the lease negotiation process. Rather than locking in a rental rate and being exposed to risk from inflation and increasing market rents, escalations help maintain a competitive rental rate over the course of the lease.
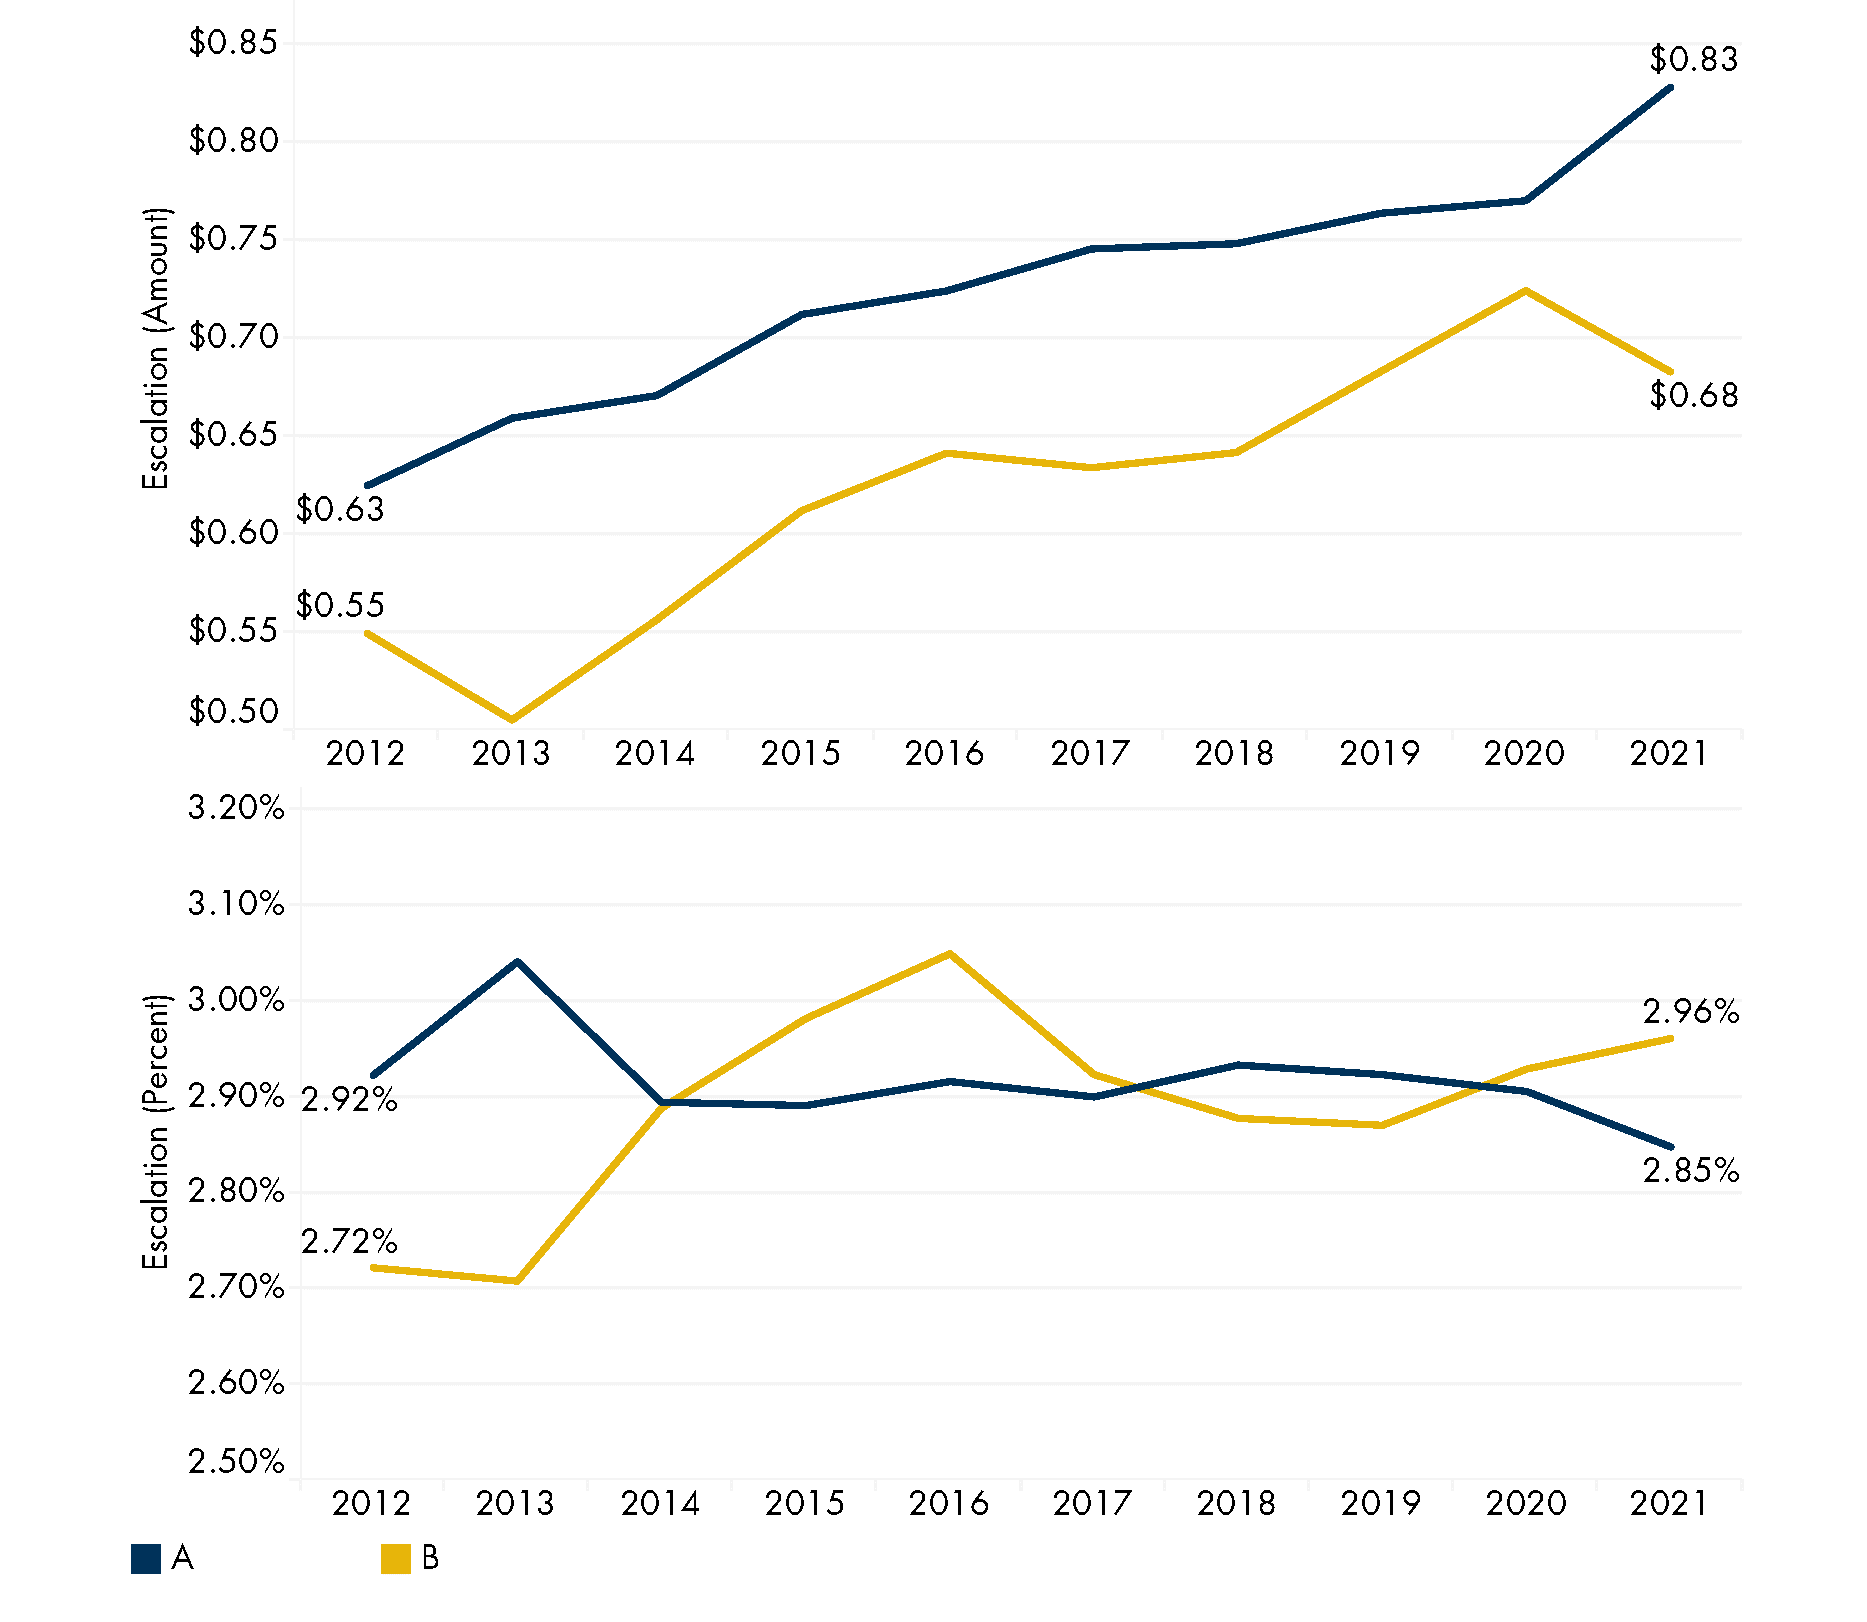
As you can see in the charts below, the average dollar value of amount escalations has slowly increased over the past 10 years to a peak of $0.83 per square foot per year for Class A space in 2021 ($0.50, $0.75, and $1.00 are common values). On the other hand, percentage escalations have remained fairly flat and have hovered around a 3% increase per square foot per year for the last 10 years.
Average Escalations per Square Foot by Building Class
Another interesting way to view escalation data is to take a look at the prevalence of each escalation type being used in the Austin market. From this perspective, it becomes clear that amount and percentage escalations have now traded places. While 74% of transactions utilized amount escalations in 2012 compared to 5% for percentage escalations, today percentage escalations have become the more popular option (61% of transactions used percentage escalations in 2021 versus 28% for amount escalations).
Popularity of Escalation Types by Percentage of Leases Signed
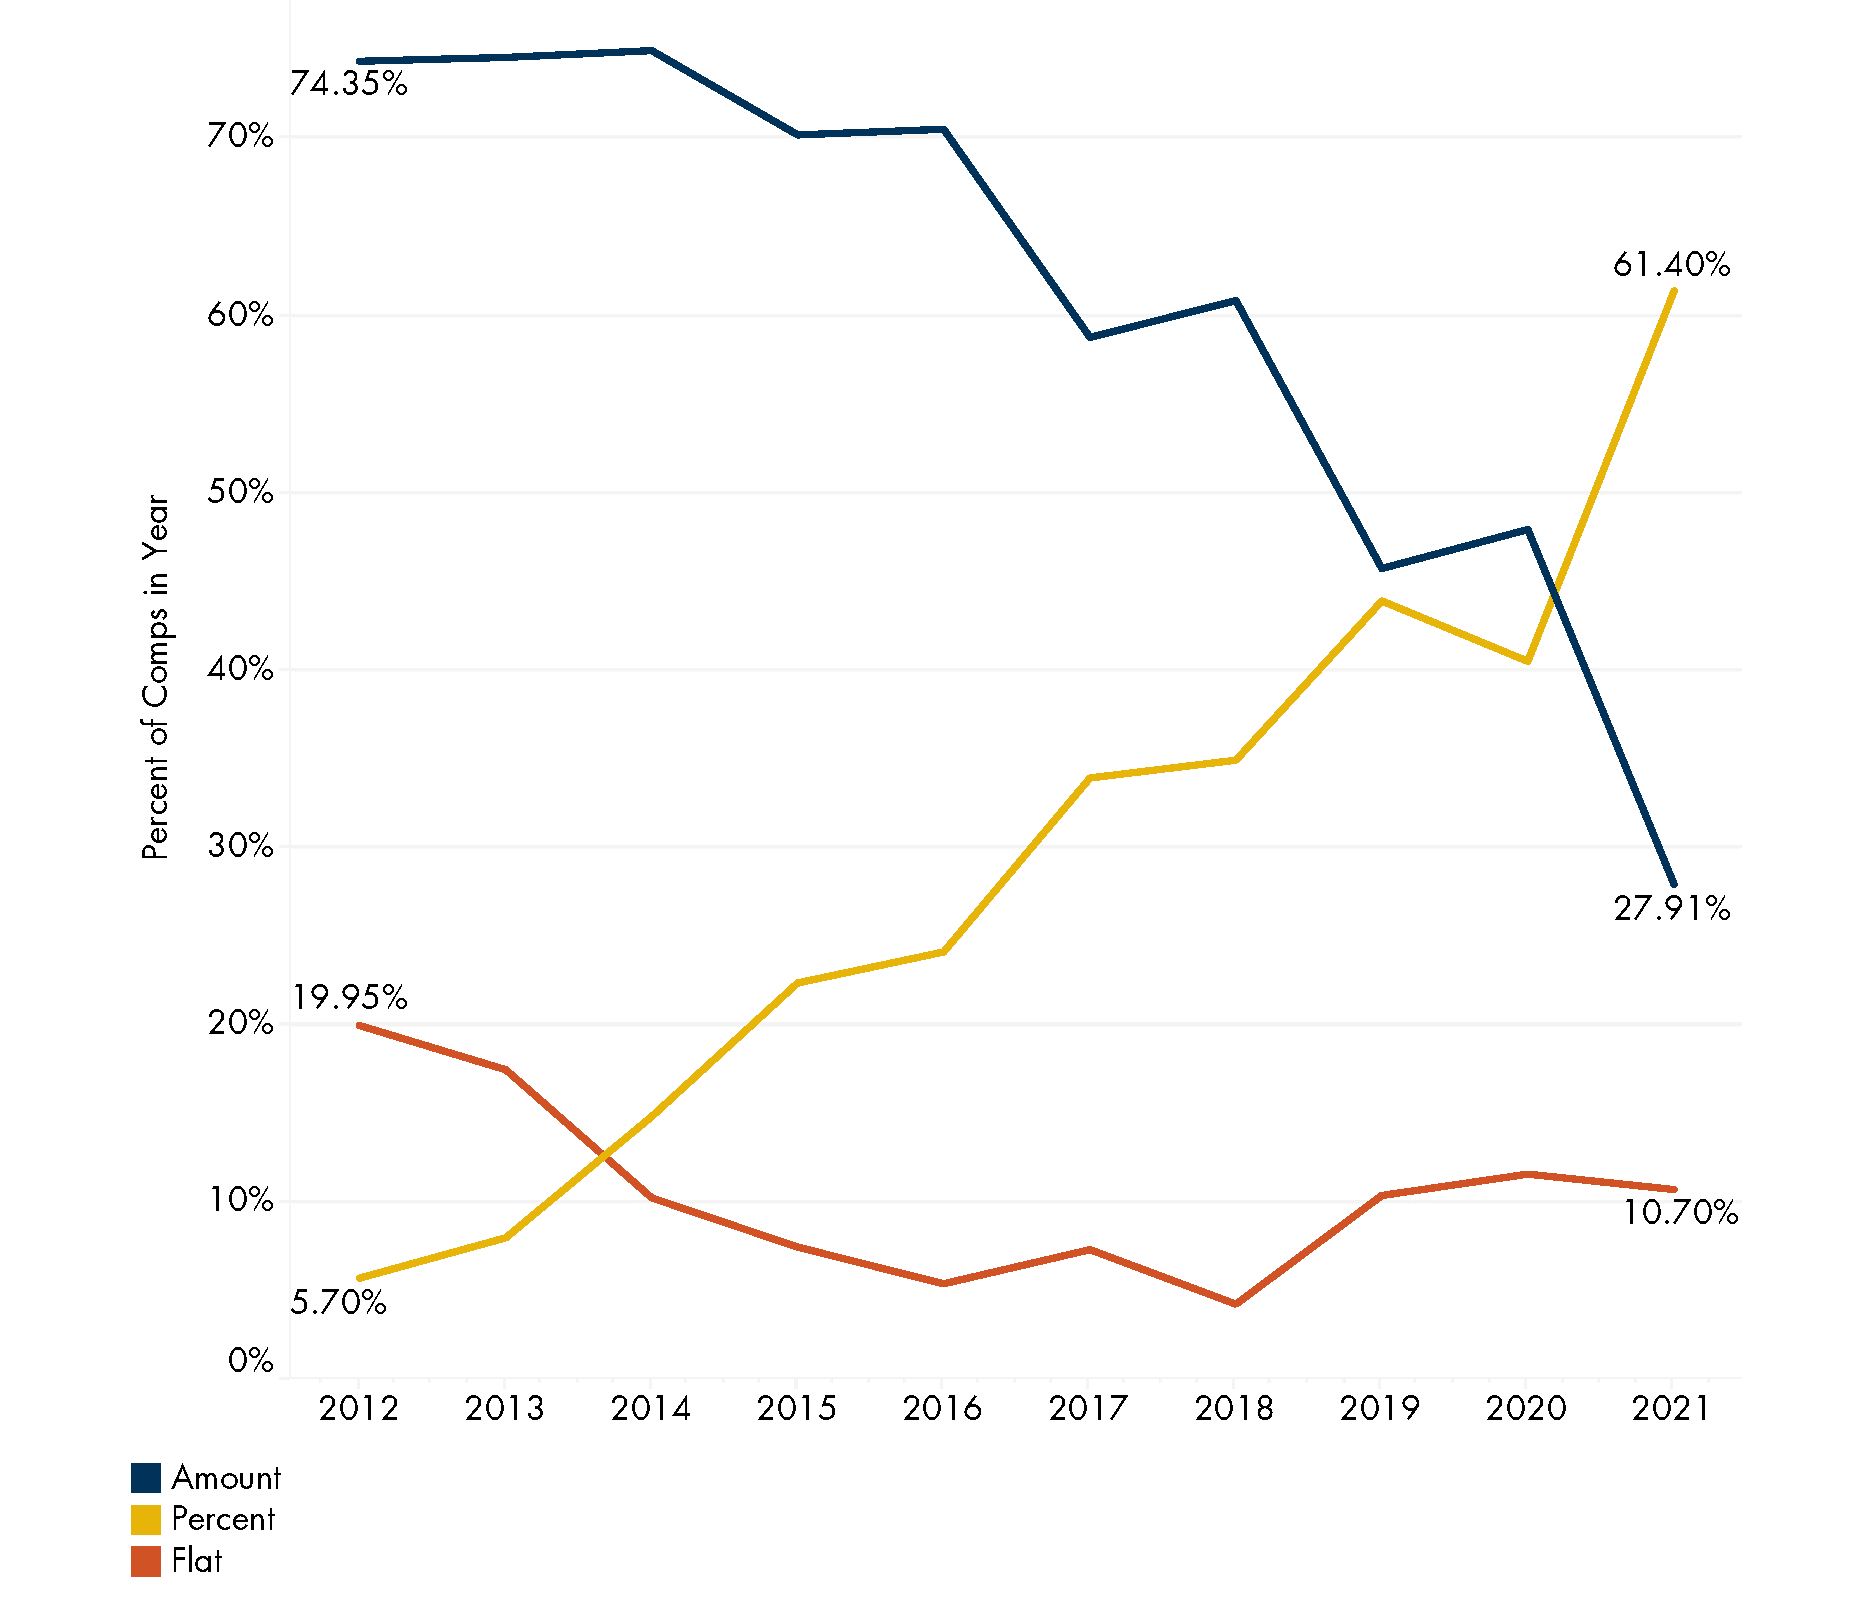
One possible explanation for this shift is that Austin’s market has been favorable to landlords in recent history. Since a 3% escalation on a $40 base rate is more valuable than a $1 escalation on the same rate, landlords have been choosing the more valuable option. It’s also likely that landlords appreciate the compounding potential of a percentage escalation as opposed to a consistent dollar amount.
Analyzing Tenant Improvement Allowances
Of all the concession types, tenant improvement (TI) allowances have the most variability and offer the best opportunity for analysis. TI can vary by transaction type, age of space, submarket, lease term, and building class, giving us ample opportunity to break it down and really dig into the numbers.
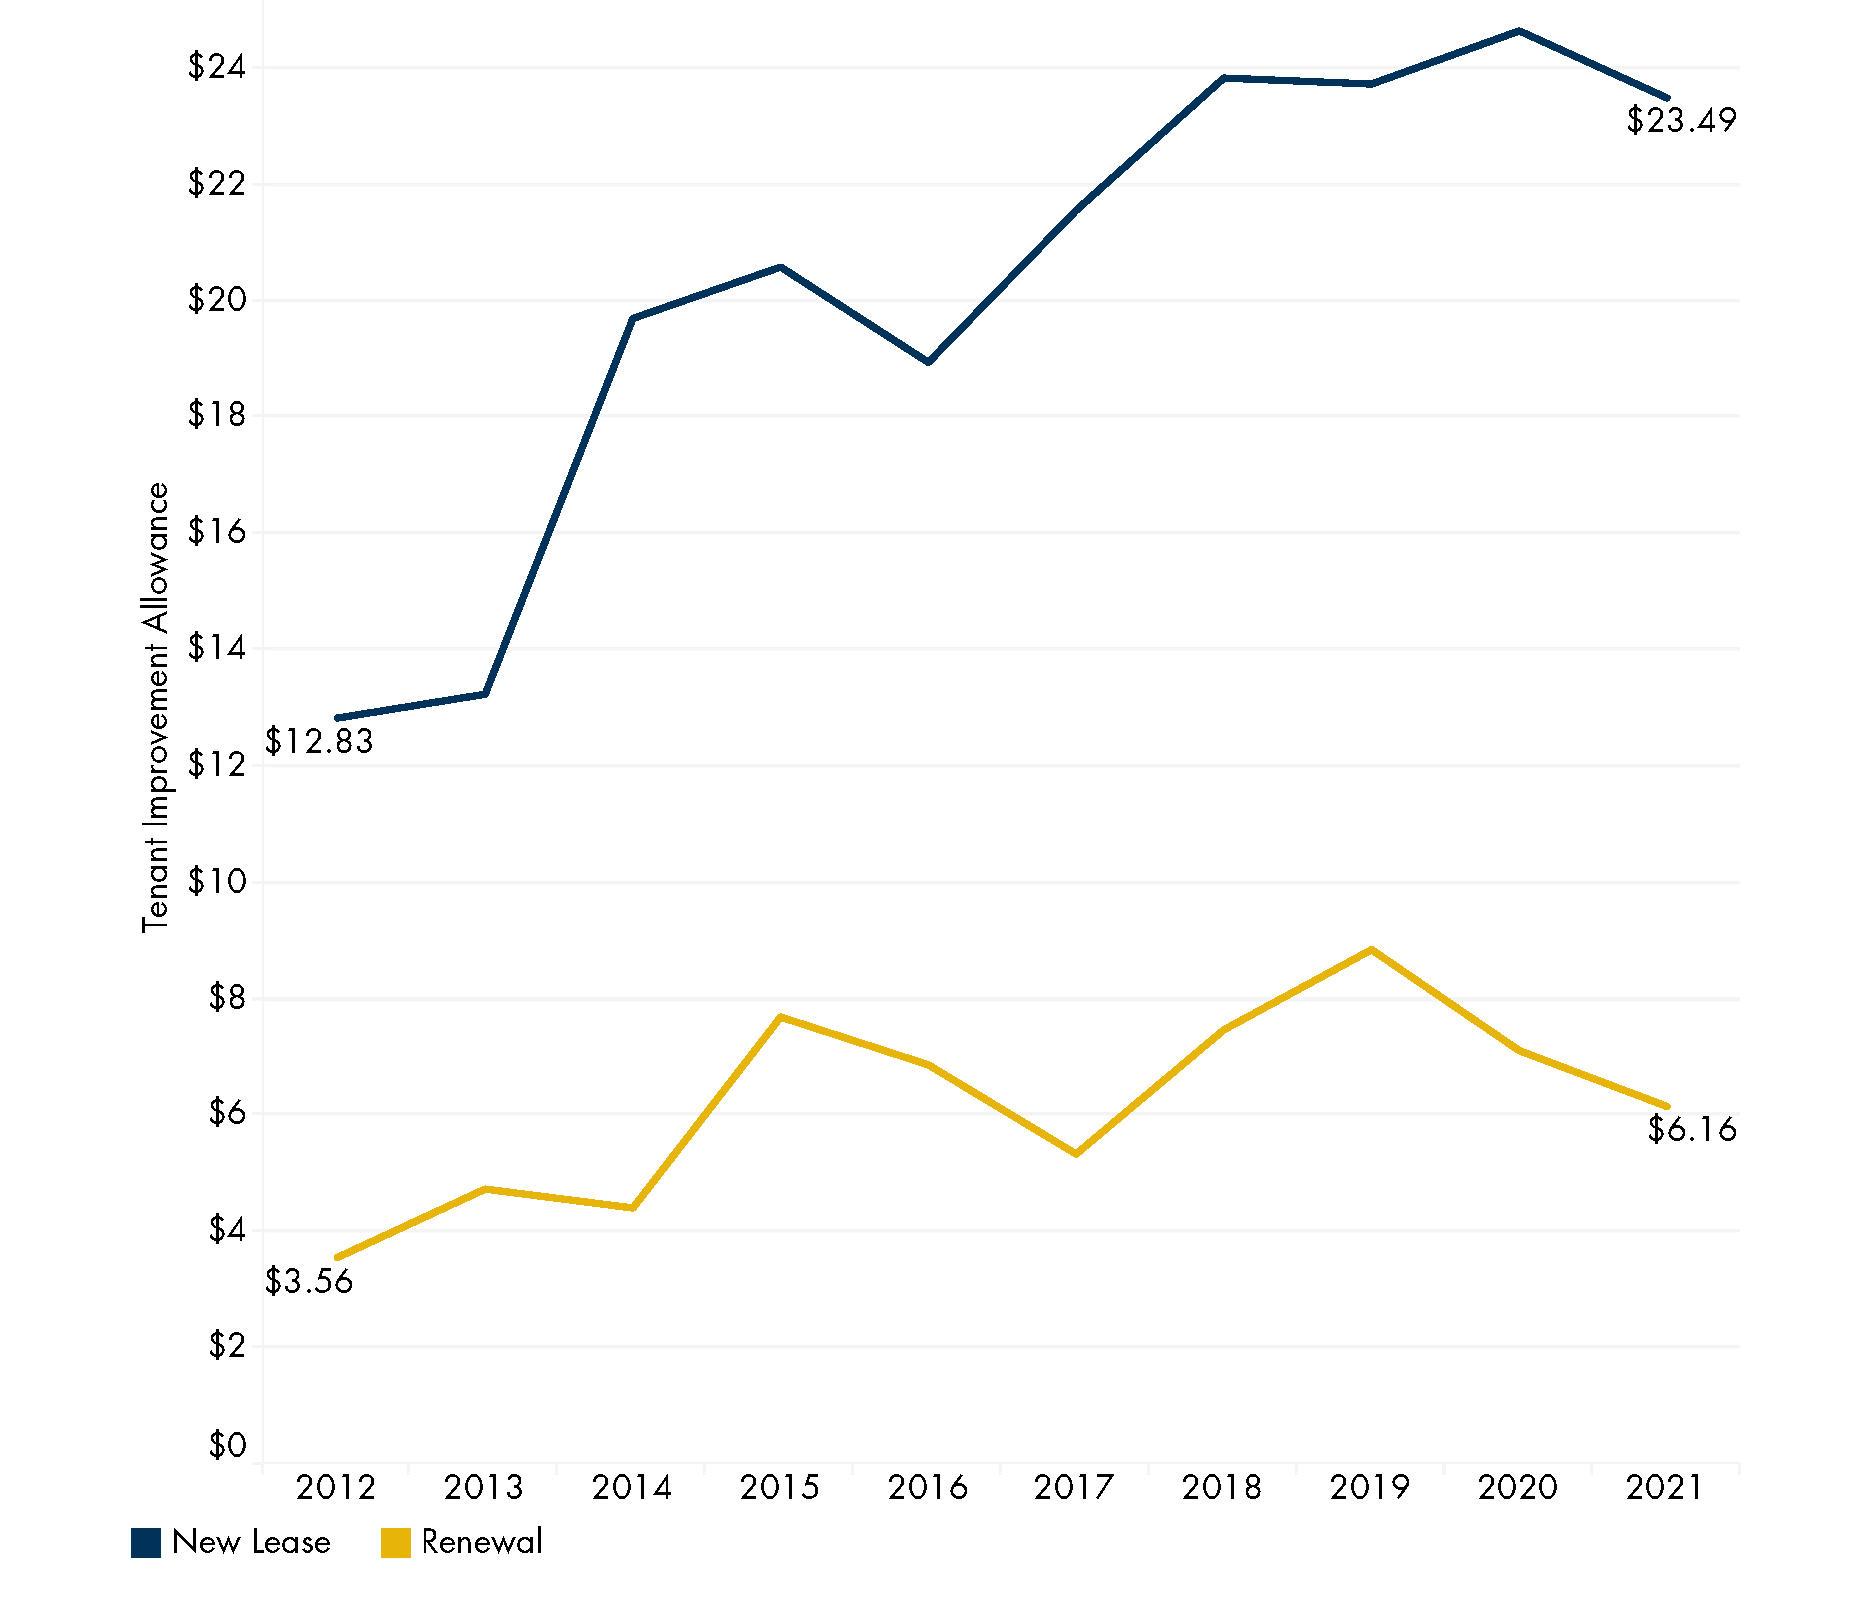
First, we can look at TI allowances by transaction type. As expected, new leases average a higher TI allowance per square foot than renewals ($17.33 more in 2021). Since new leases typically entail some form of a space buildout before the tenant is able to move in, offering a higher TI allowance for these transactions is common.
Average TI Allowance per Square Foot by Transaction Type
Of course, the amount of TI offered by a landlord also heavily depends on the current condition of the space being leased. Newly constructed shell space requires a more significant tenant buildout than second-generation spaces do, typically necessitating a higher TI allowance. To explore these differences we have also separated transactions into two groups – transactions in new space (pre-leased before delivery or signed within a year of delivery) and transactions in second-generation space.
Average TI Allowance per Square Foot by Age of Space
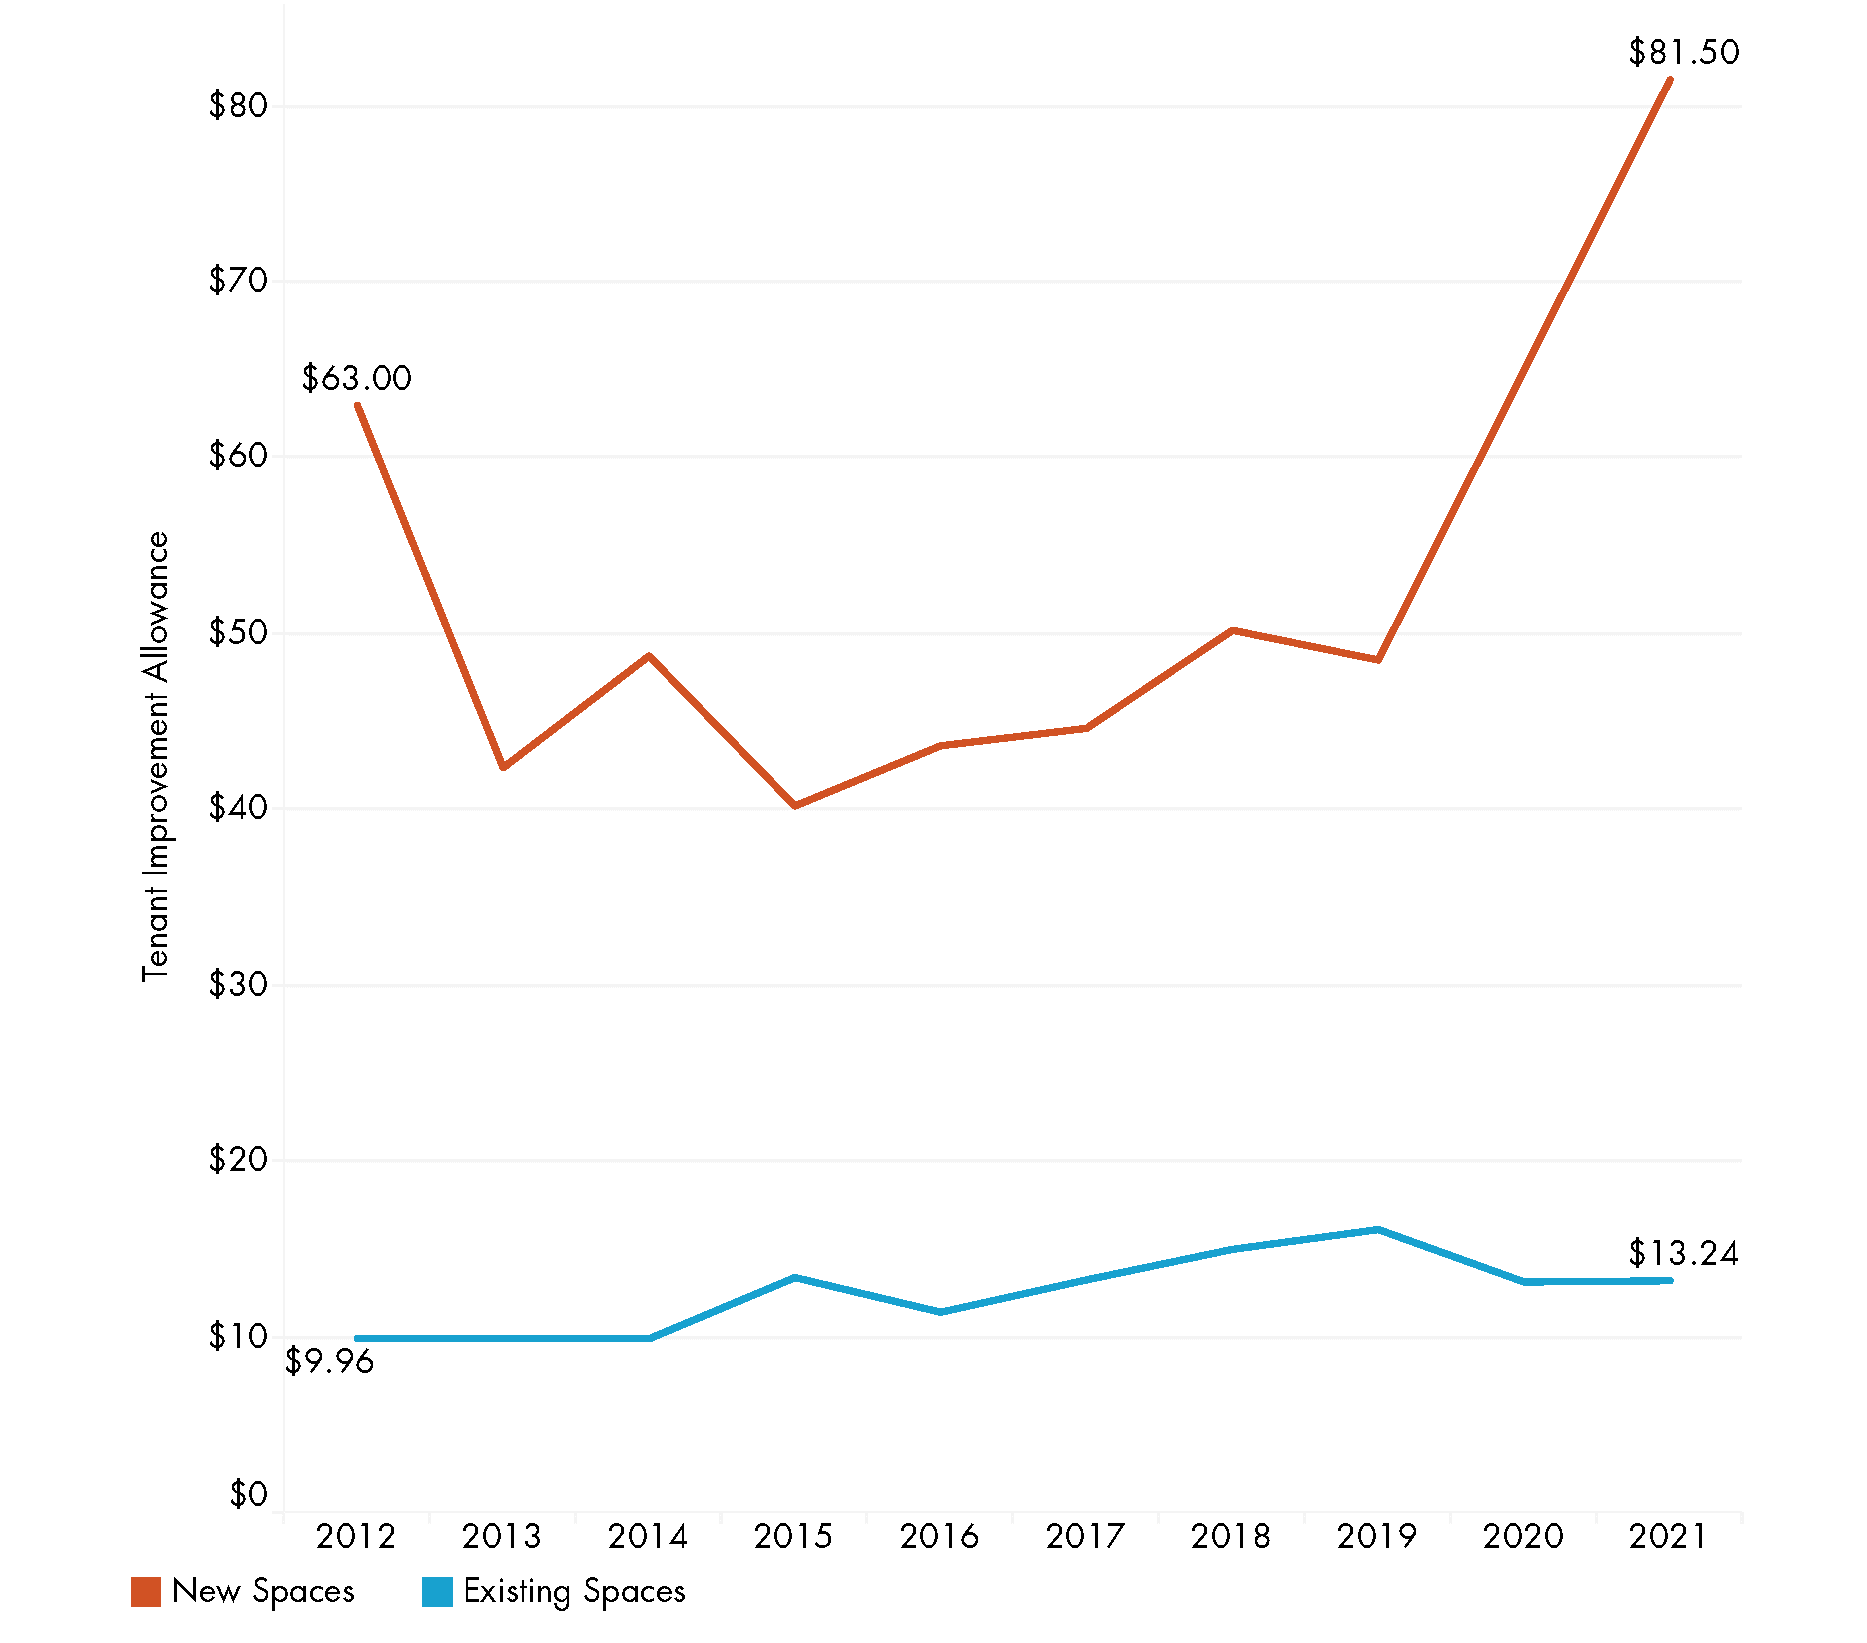
As you can see, new spaces see significantly higher TI allowances on average than existing spaces. Leases for new space in 2021 saw an extremely high TI allowance being offered, largely due to major leases like Skyworks, Cloudflare, Canva, and Ottobock being signed with TI allowances above $80 per square foot.
Another method to break down tenant improvement allowances is by submarket. It would be fair to assume that TI allowances should be fairly similar across Austin’s four primary submarkets, but is that actually the case?
Average TI Allowance per Square Foot by Submarket (2012-2021)
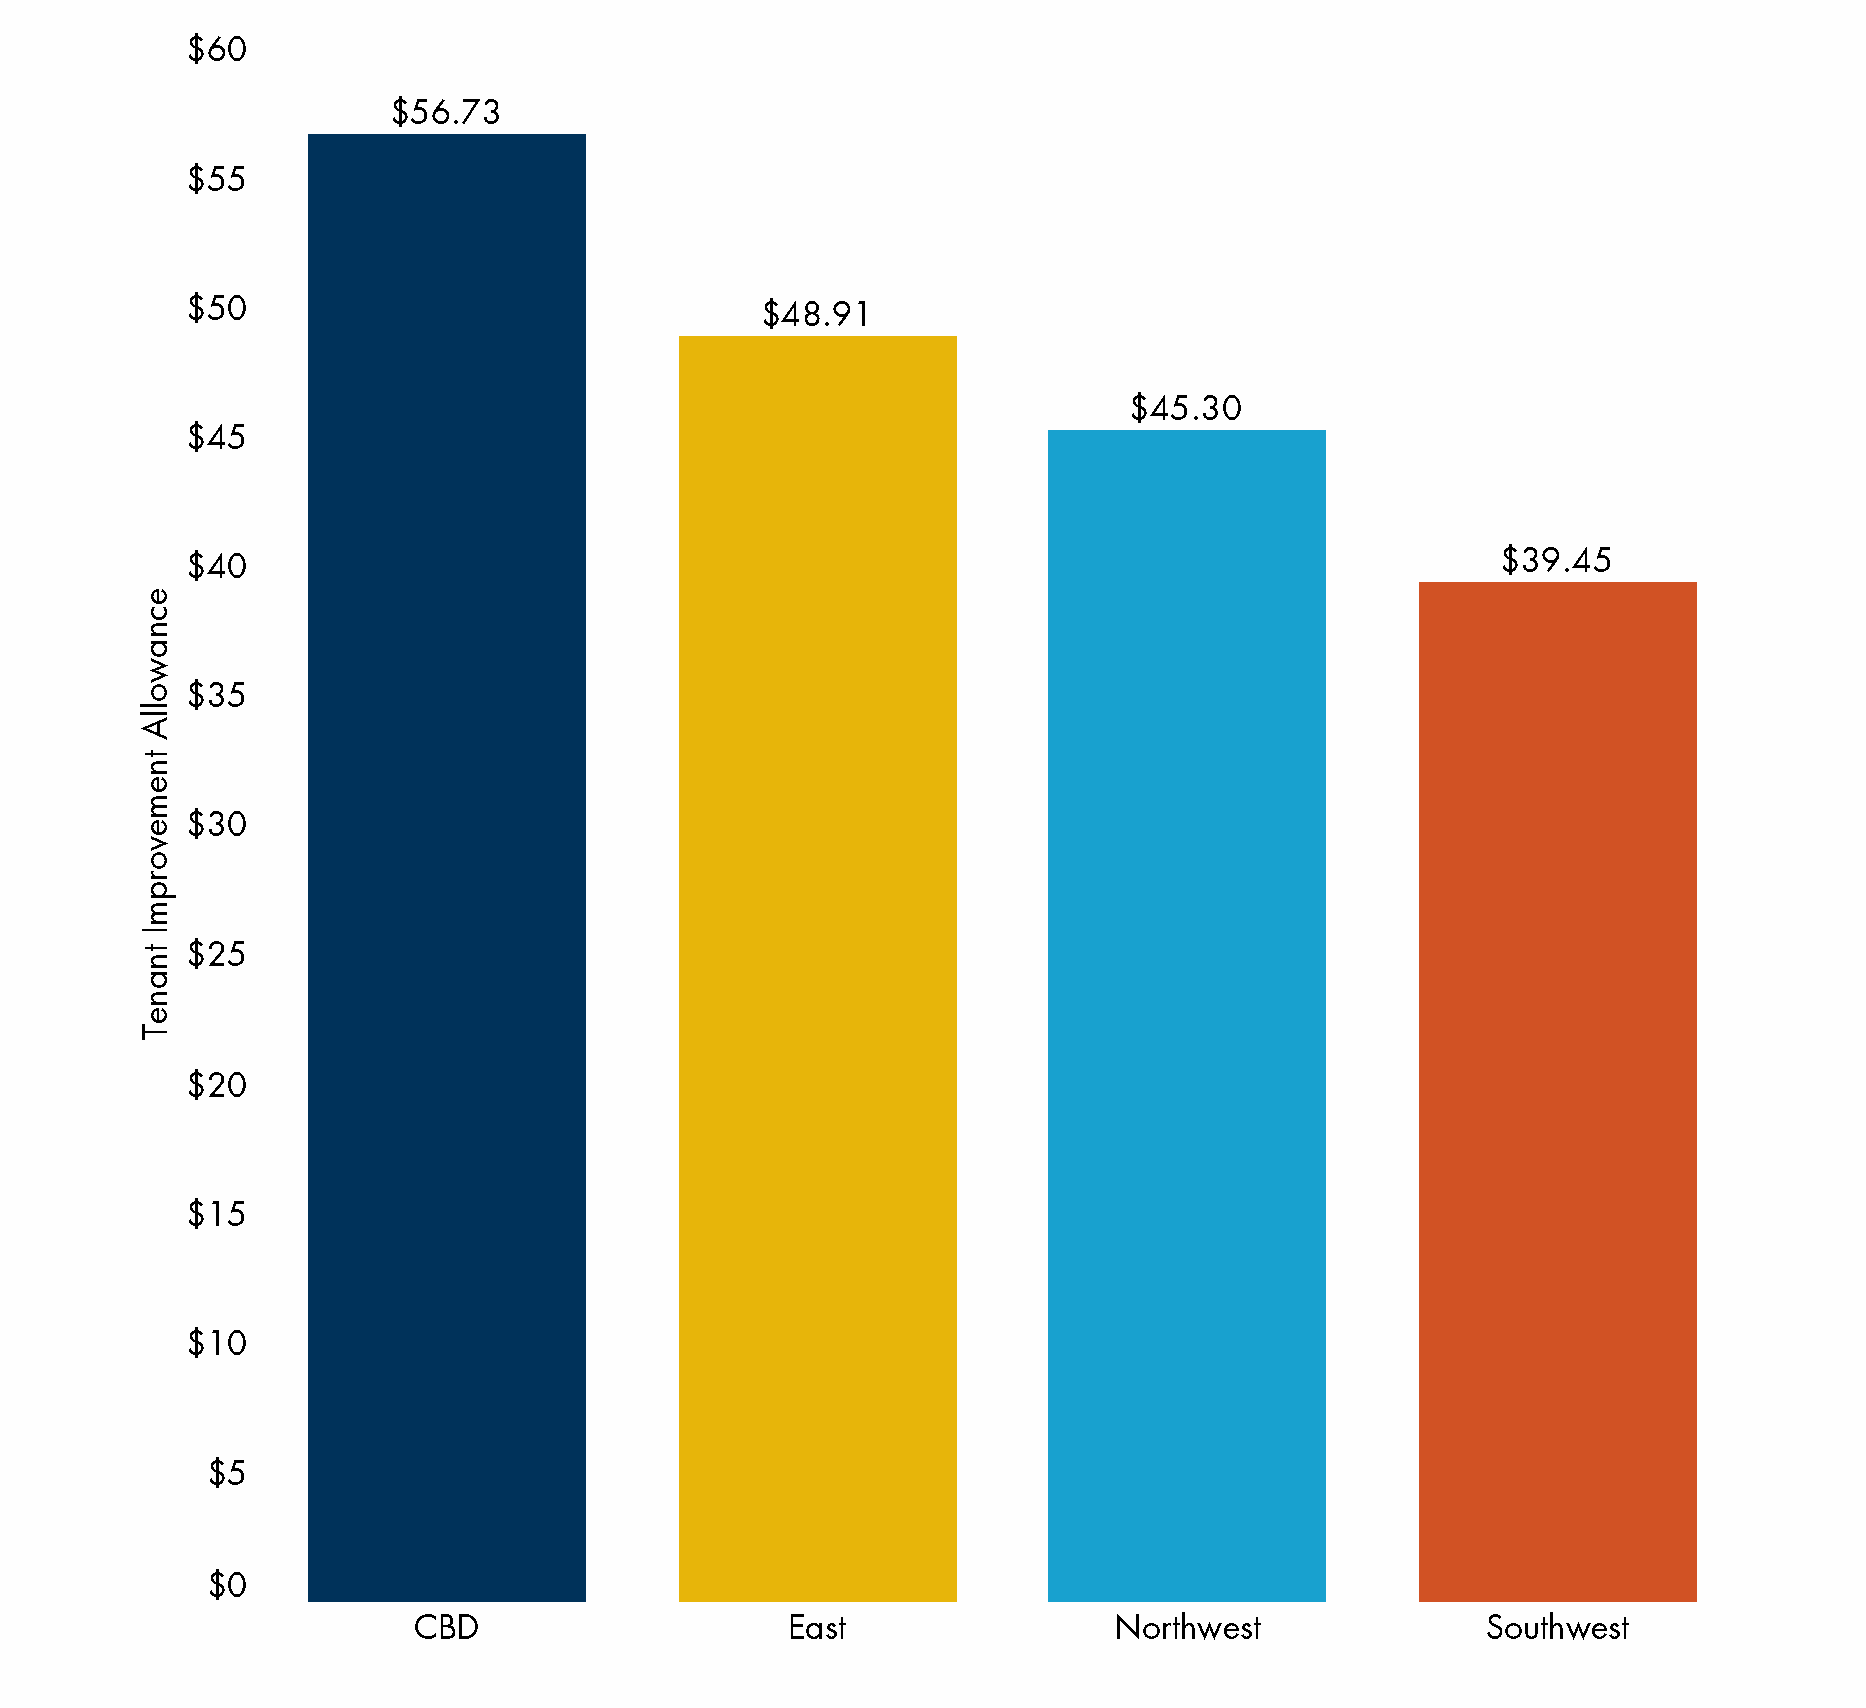
As it turns out, not quite. Tenants signing leases for newly-constructed space in the CBD have averaged higher TI allowances than their Northwest and Southwest counterparts, and TI allowances for East tenants have been extremely variable (likely due to the relatively low deal volume and relatively high new construction volume).
Similar to free rent, lease term also has an impact on TI allowances. Since landlords gain more financially from long-term leases, they are willing to offer more money for a tenant’s buildout.
Average TI Allowance per Square Foot by Lease Term
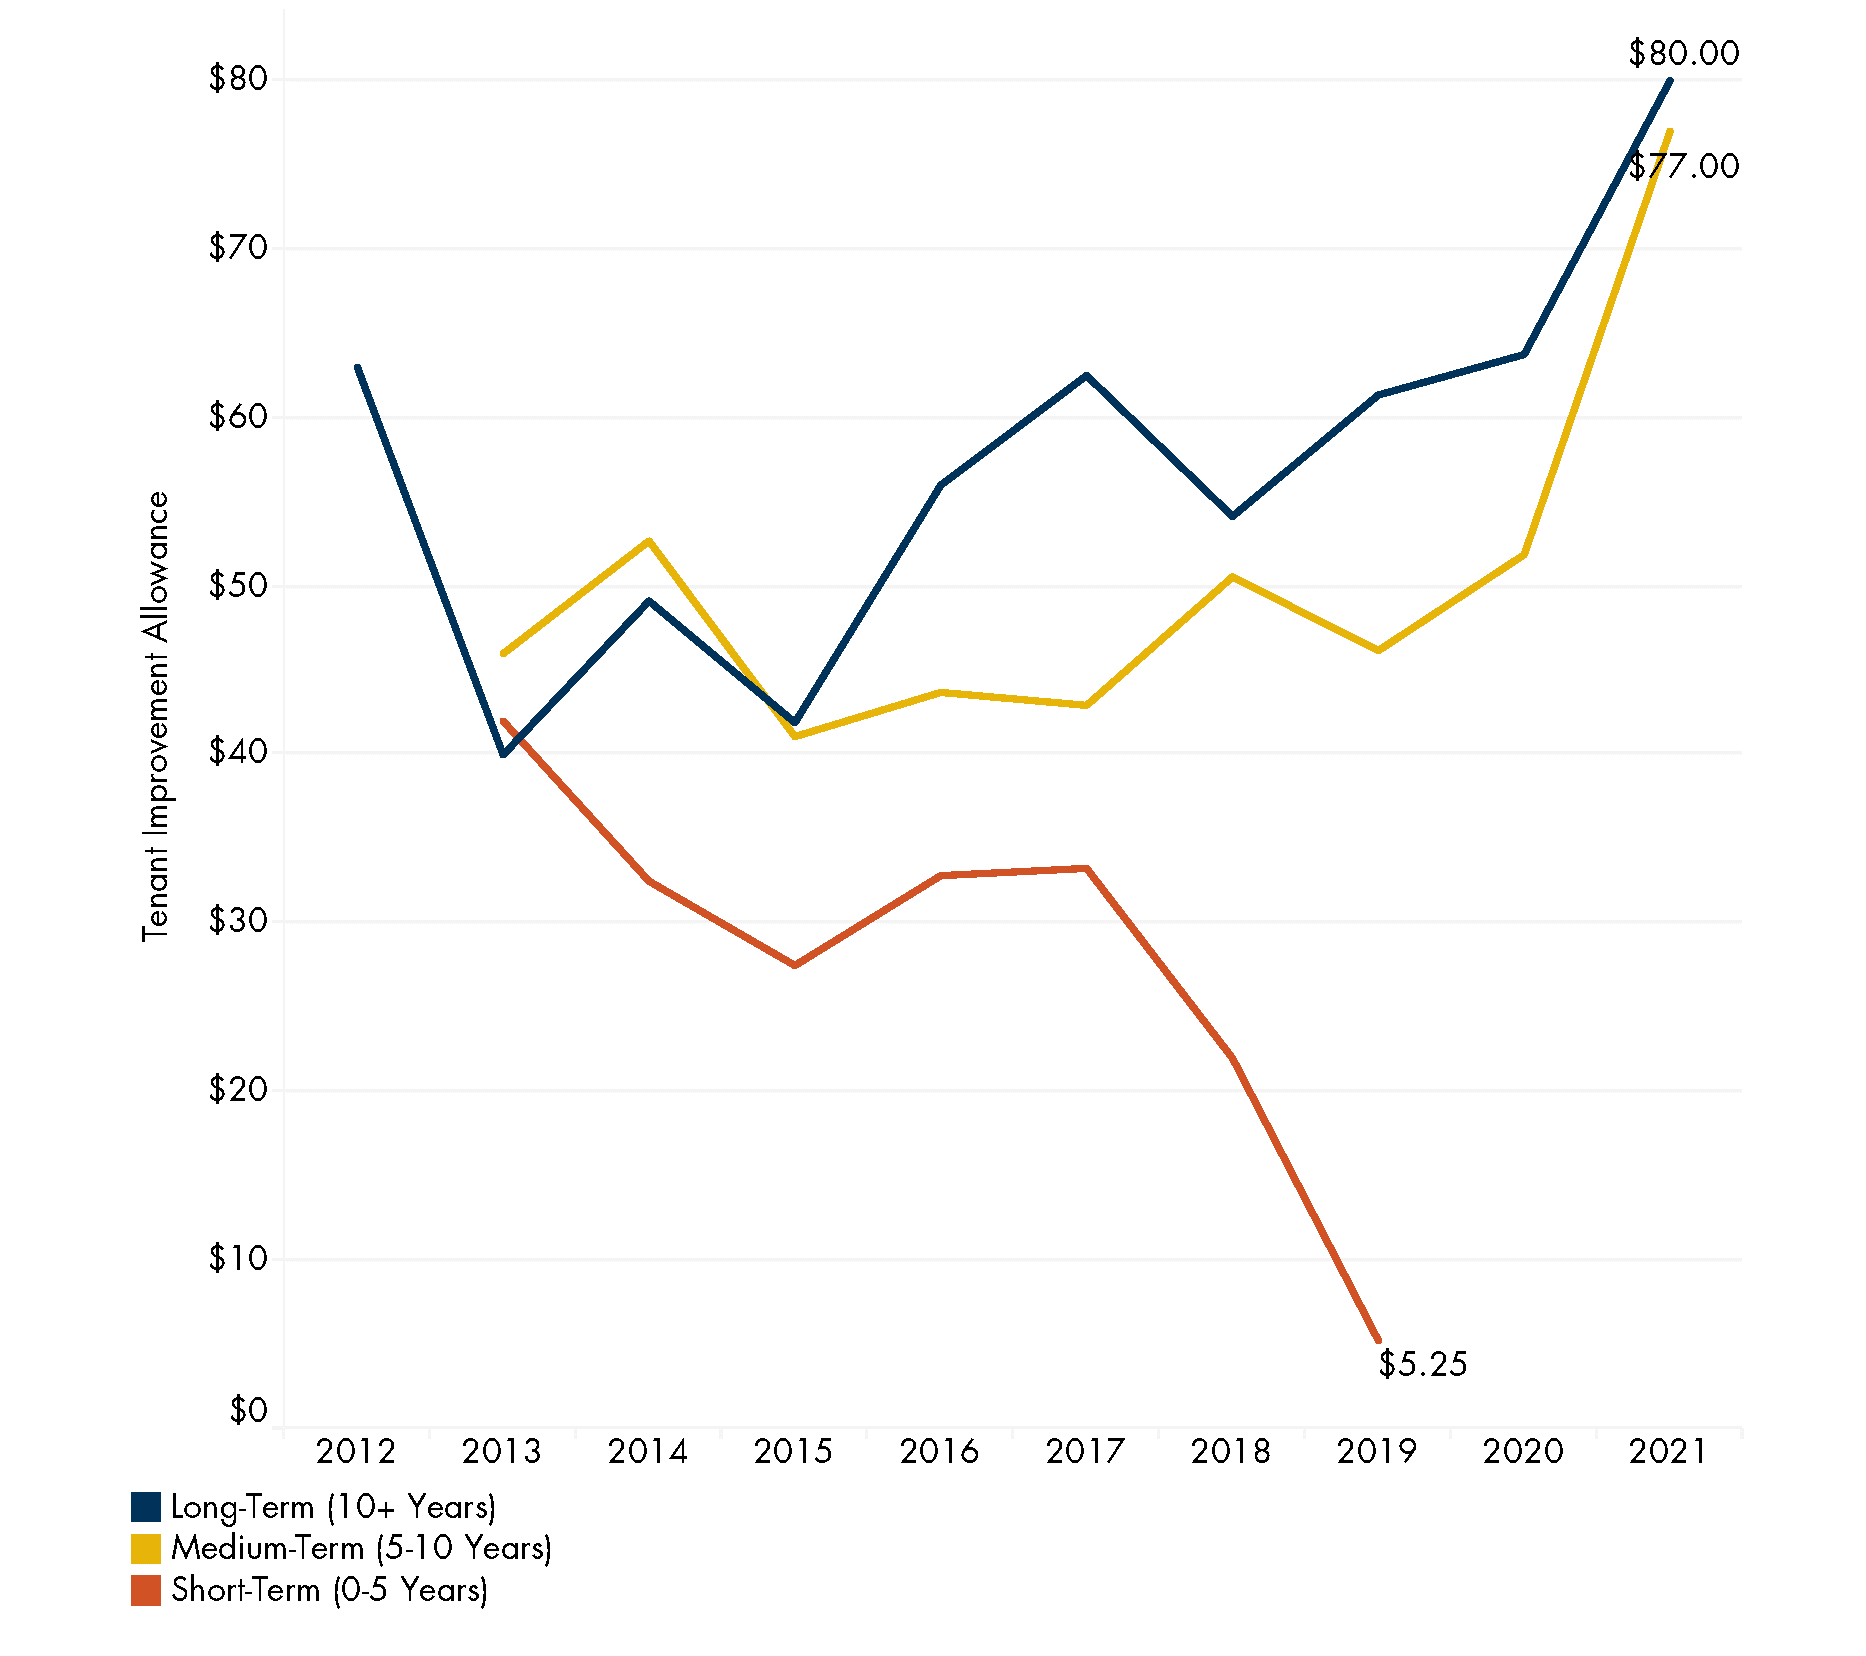
Based on the data, long-term leases have historically received the highest TI allowances, averaging $80 per square foot in 2021 compared to $77 per square foot for medium-term leases. Since it is relatively uncommon for a TI allowance to be offered on short-term leases, our data showed no relevant short-term transactions with TI allowances in 2020 or 2021.
Taking this correlation out to a single value, the data suggests one month of lease term is equal to roughly $0.25 per square foot in TI allowance for new leases and $0.11 per square foot for renewals.
Average TI Allowance per Square Foot by Building Class
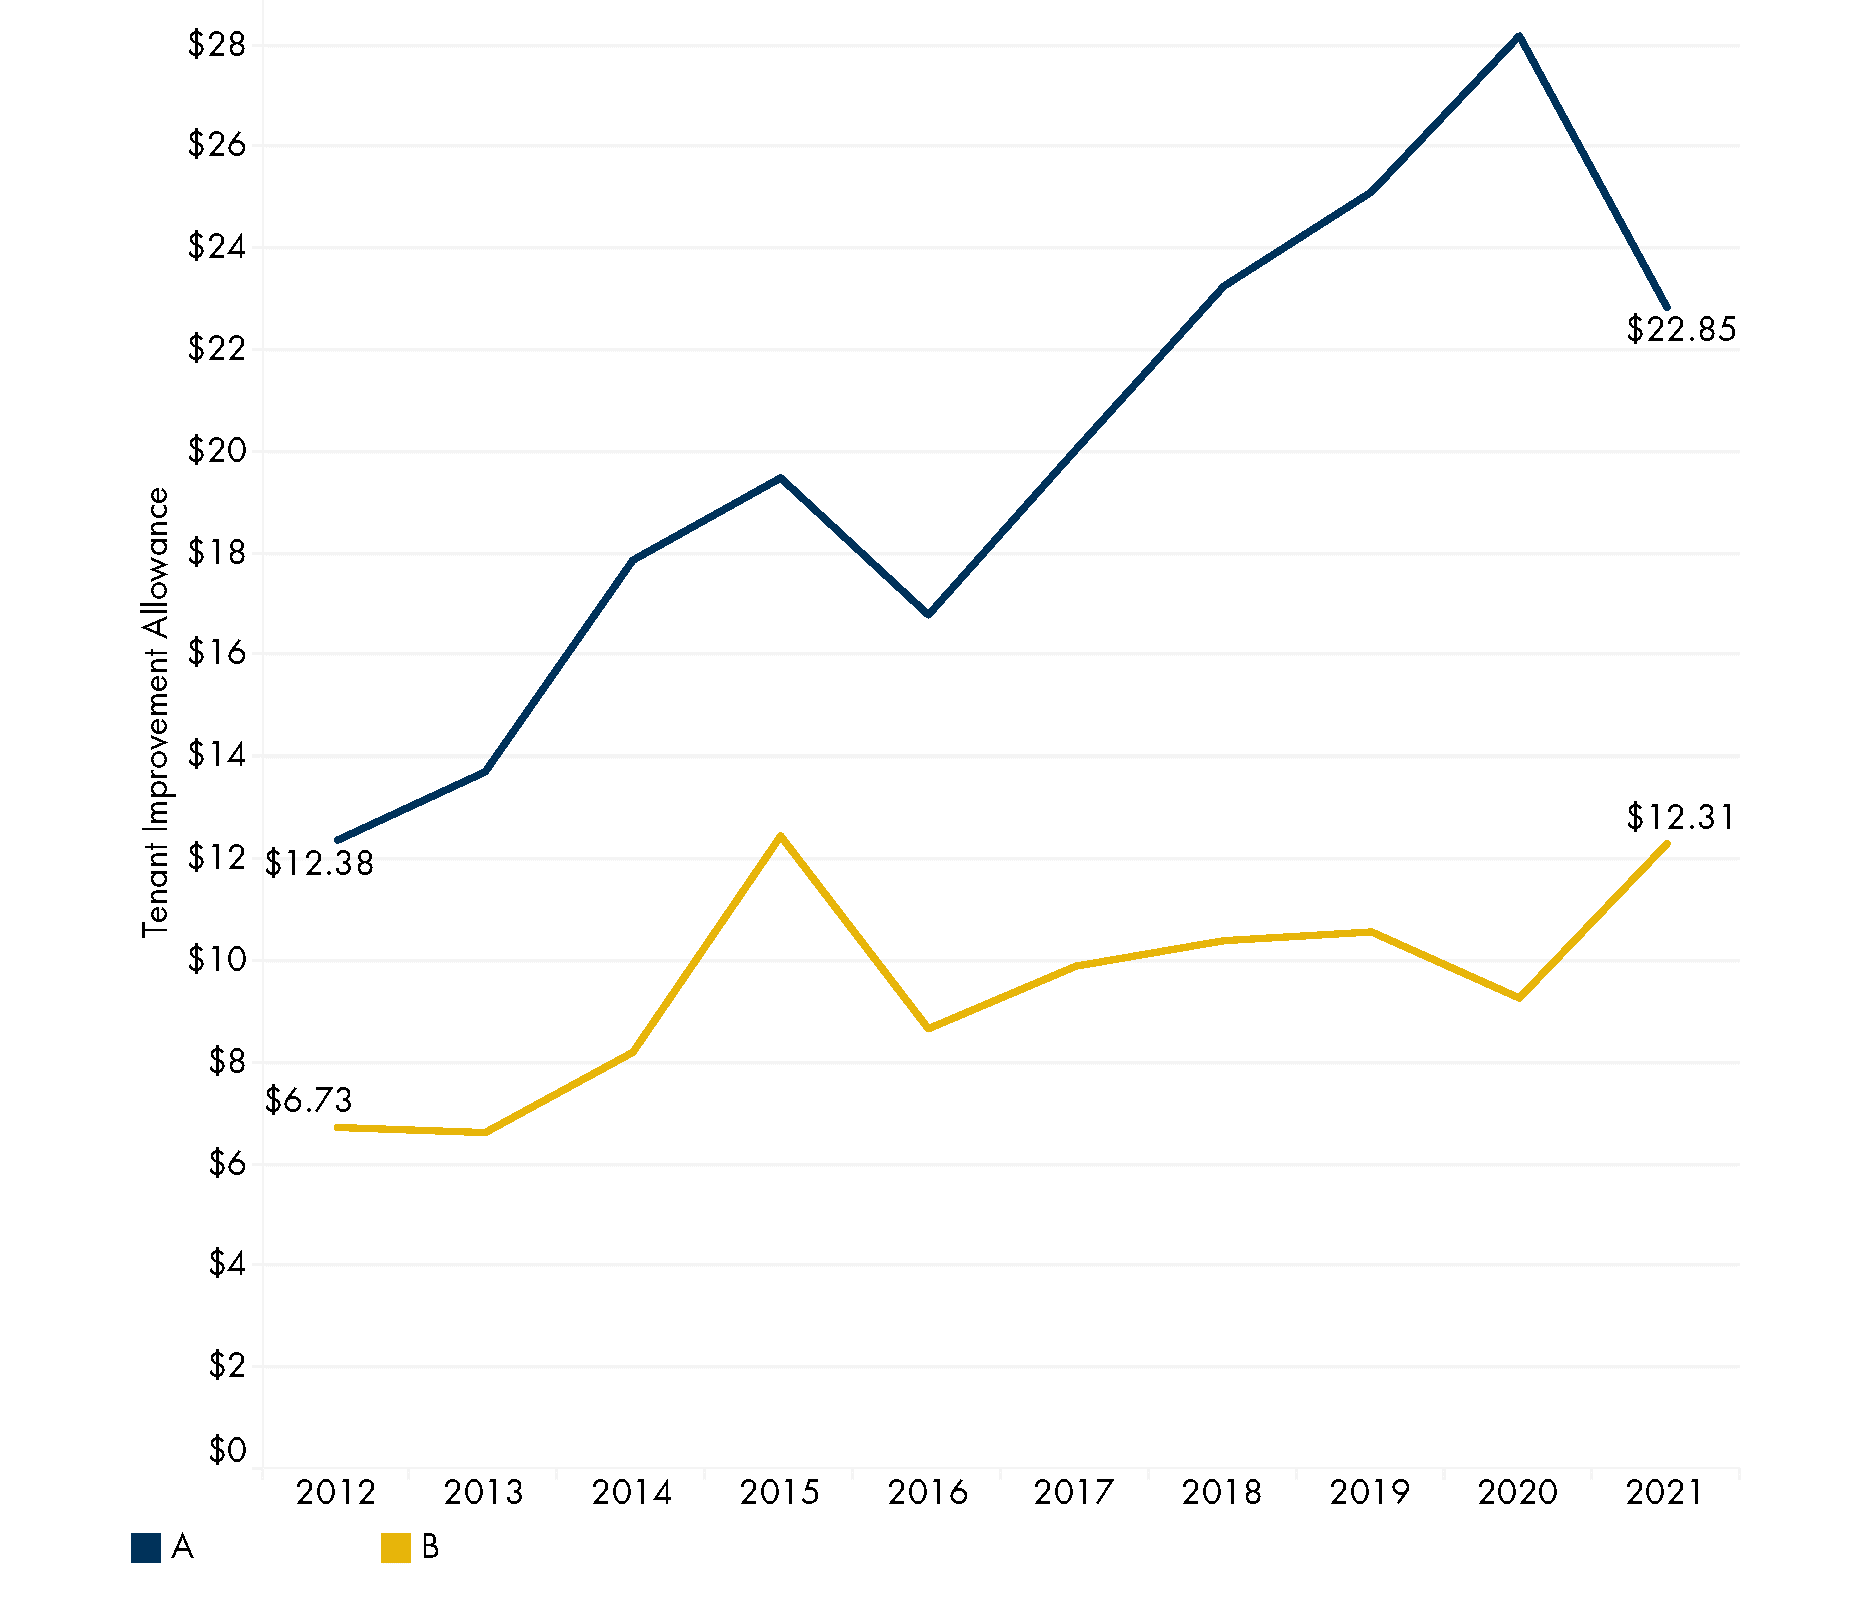
To round out this analysis of TI allowances we also took a look at the simplest comparison of all – Class A versus Class B space. As the chart makes clear, Class A office spaces receive a higher TI allowance on average ($10.54 per square foot more in 2021). Some of this difference can be explained due to new construction being included in the Class A averages.
Another explanation of the difference is that Class A tenants more regularly undergo extensive buildout projects than their Class B counterparts. Class A spaces also achieve higher asking rental rates than class B spaces, so landlords have the flexibility to offer a higher TI allowance without reducing the NEBR below target levels.
Changes in Net Effective Base Rates
So, we’ve now looked at free rent, escalations, tenant improvement allowances and how each of these concessions can vary depending on building class, age, transaction type, and location. All of this information is great, but what does it mean in actual financial impact for tenants and landlords?
To answer that question, we have to look at net effective base rates.
The NEBR is calculated by taking the dollar value of the lease over the entire lease term (accounting for free rent and escalations) and subtracting out the value of the TI allowance. Additional free rent and TI dollars decrease the NEBR, while higher escalations increase it.
Net Effective Base Rate = Average Annual Base Rate Per SF – Free Rent – (TI Allowance Per SF / Lease Years)
NEBR gives us the ability to see the “true” financial value of a lease and is the reason asking base rates don’t quite tell the full story of an office transaction.
Average Net Effective Base Rate per Square Foot by Building Class
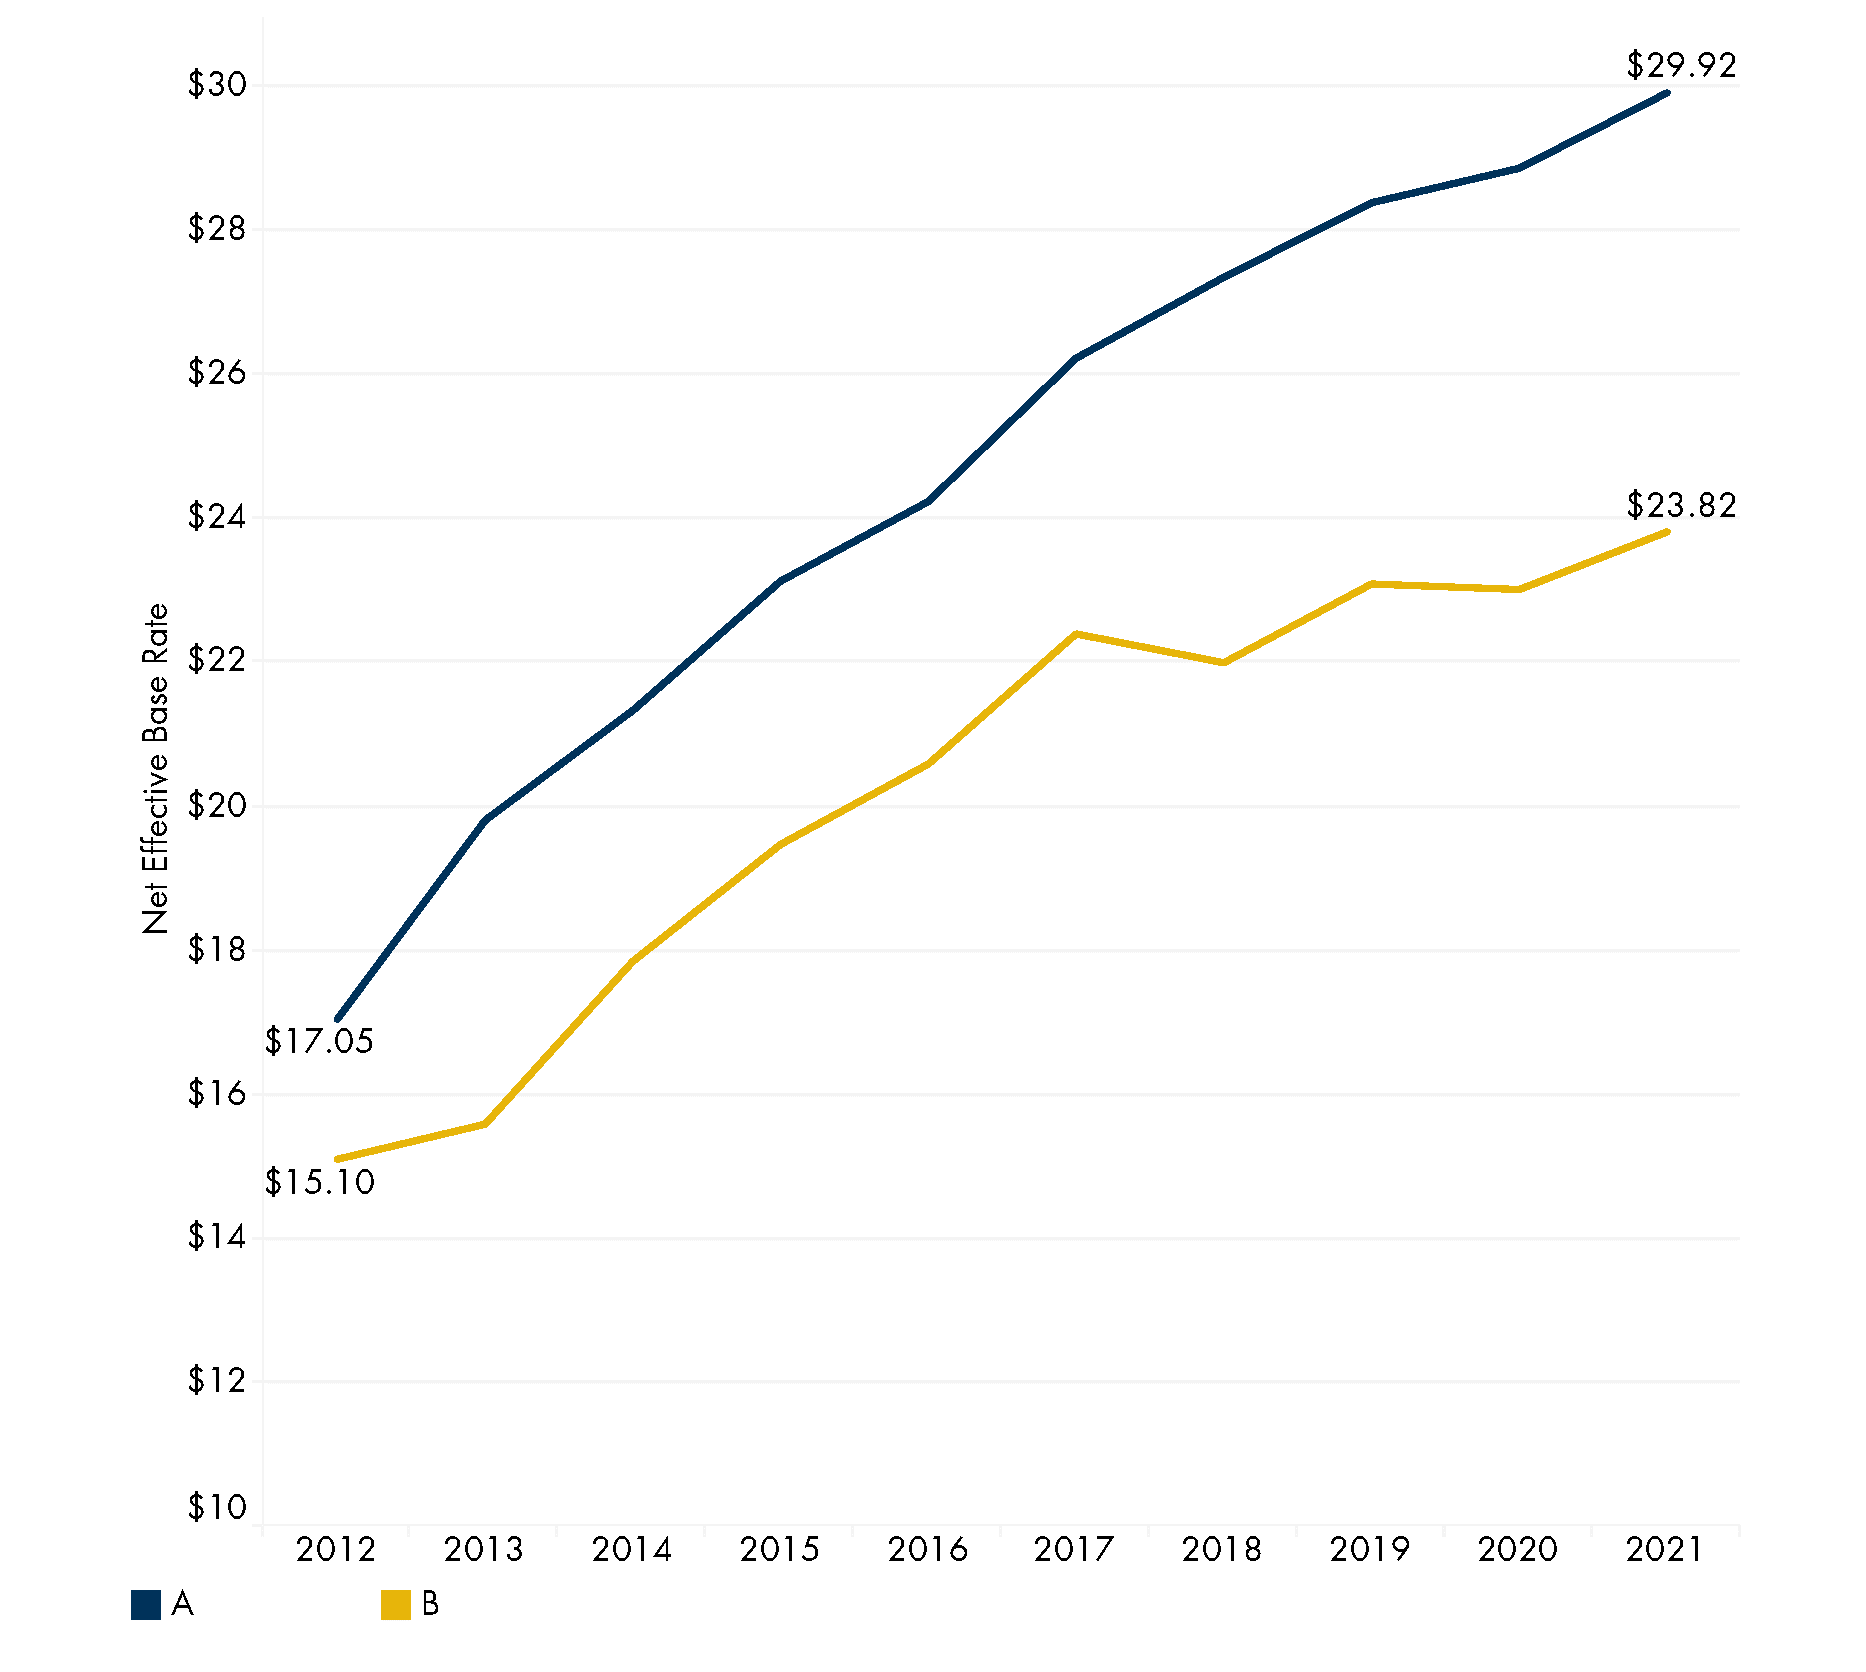
As you can see, net effective base rates have steadily increased in Austin over the past 10 years, rising from $17.05 for Class A space in 2012 to $29.92 in 2021 (a 75% increase). Also of note is the relative flattening of NEBRs for Class B space in recent years compared to the continued upward trajectory of Class A space.
However, to really bring this analysis full circle we need to compare how the delta between NEBR and asking base rates has changed over the years. As we discussed at the beginning of this article, understanding this delta allows us to see the difference between what landlords are quoting with their asking base rates versus where leases are actually being signed once concessions and escalations are taken into account.
Net Effective Base Rate Delta per Square Foot by Submarket
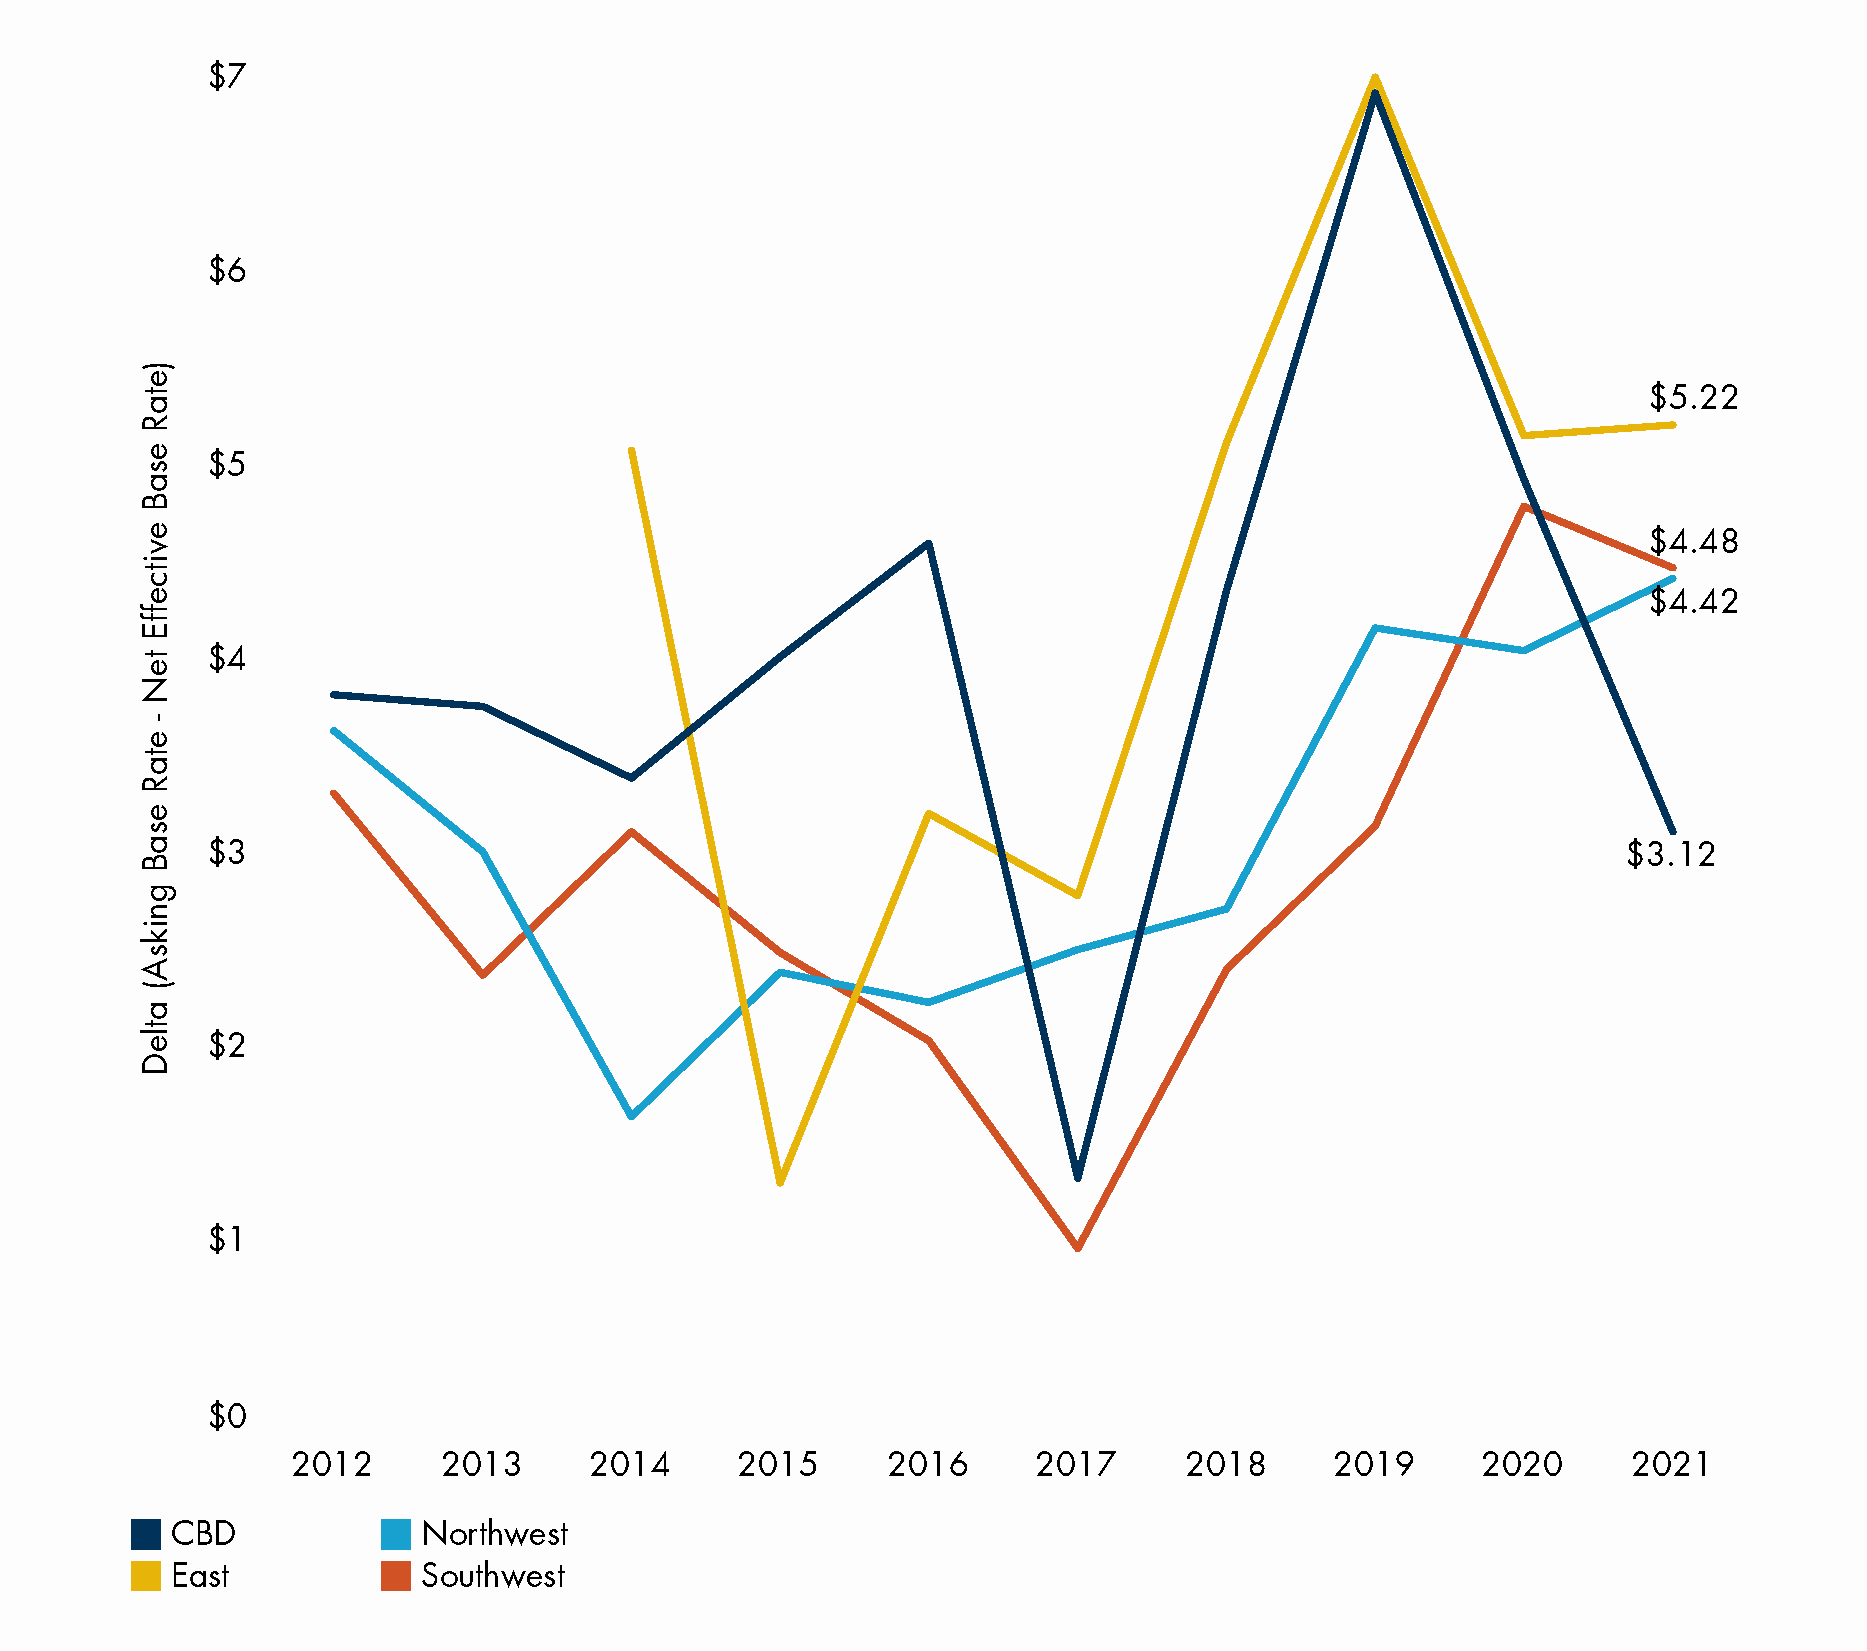
As you can see, NEBRs are between $1 to $7 lower than asking rates on average. In other words, if a landlord is quoting an asking base rate of $35 per square foot, by the end of lease negotiations and concessions the NEBR could be only $30 per square foot. For a 10,000-square-foot tenant, this could mean a savings of $50,000 per year from the “advertised” price. Stretching that lease out to 10 years would mean a total savings of roughly $500,000.
What This Means for Landlords
Don’t only focus on the quoted asking rates in your building’s competitive set. While it might be easier to pull asking rates from flyers and compare your building that way, it’s much more important to know how your building compares on an NEBR-basis. Having an experienced market researcher on your team who can assist with collecting and analyzing lease comps in surrounding buildings will help you stay competitive.
What This Means for Tenants
Understanding how concessions and escalations impact the NEBR can be a useful tool during the lease negotiation process. Although Austin is still more or less a landlord’s market and you may not be able to deviate too much from the landlord’s initial terms, asking for a little more free rent or a slightly larger TI allowance can help bring down your NEBR and get you a further discount from the advertised price. Hiring a tenant representation broker to help with these negotiations is an important step (and doesn’t even cost you anything).


