This article was originally published in AQUILA’s 1Q 2020 Austin Office Market Report. This article will not be updated, but please contact us if you have specific questions regarding the information in this article.
In today’s landscape and in the face of vast uncertainty, a seemingly unprecedented number of forecasts and models are being circulated that attempt to predict what the future of our city, state, country, world, and markets will look like.
In this vein, we expect many of our readers are working to anticipate the future of our office market – specifically the Austin Central Business District (CBD).
To answer this question, AQUILA has tapped its market knowledge and expansive historical data to reorient our growth models and provide a picture of how the CBD office market may perform in the coming years.
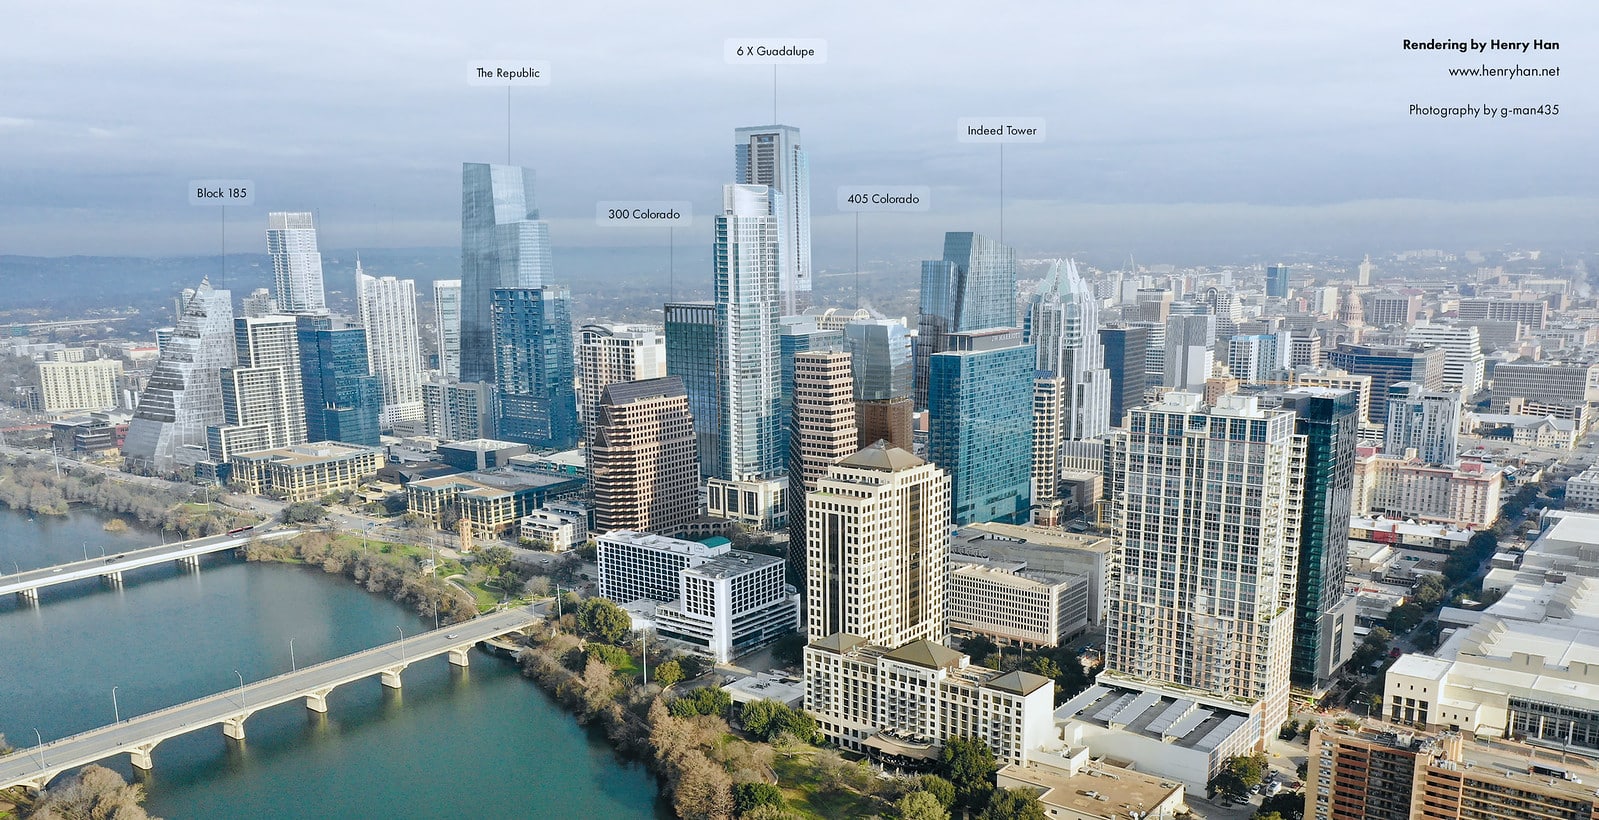
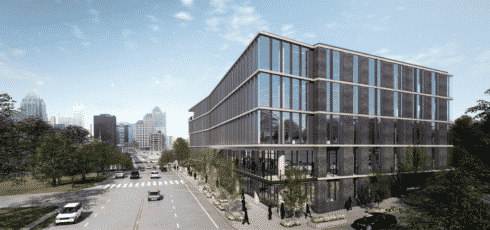
Rendering of the future Austin skyline, courtesy of Henry Han.
Three Scenarios for the Future of the CBD
For the purposes of our analysis, we formulated three scenarios to reflect the range of recessionary expectations we’ve observed in the marketplace today. Major assumptions for each scenario are detailed below:
| Scenario | Variable | 2020 | 2021 | 2022 | 2023 | 2024 |
| Base Case | Job Growth | 0.0% | 1.0% | 2.0% | 3.8% | 2.2% |
| Sublease % of Market | 5.0% | 3.0% | 2.0% | 2.0% | 2.0% | |
| Coworking Default Space | 67,019 SF | 0 | 0 | 0 | 0 | |
| Upside | Job Growth | 0.0% | 3.0% | 3.5% | 3.2% | 2.3% |
| Sublease % of Market | 2.0% | 2.0% | 2.0% | 2.0% | 2.0% | |
| Coworking Default Space | 0 | 0 | 0 | 0 | 0 | |
| Downside | Job Growth | -3.5% | -2.5% | 0.5% | 3.3% | 2.2% |
| Sublease % of Market | 5.0% | 5.0% | 3.0% | 2.0% | 2.0% | |
| Coworking Default Space | 268,076 SF | 0 | 0 | 0 | 0 |
Our methodology is explained at the end of this article. Details on how we made our absorption forecasts are outlined in each scenario.
For all of the scenarios, we conservatively assume that only projects currently under construction will deliver within our forecasted horizon. In other words, no projects that are currently proposed will be delivered by the end of 2024.
Base Case
Similar to the years after the Great Recession (post-2008), this scenario assumes a temporary job growth slowdown, followed by a gradual climb back to levels enjoyed in Austin in recent history (roughly 3% year-over-year job growth in the Austin-Round Rock MSA for the last five years). This scenario also assumes sublease availability downtown will jump to 5% of the downtown office market but trend back down to 2% where it is today. Finally, we have assumed roughly 70,000 square feet (about 12%) of downtown coworking space will go into default as part of this scenario.
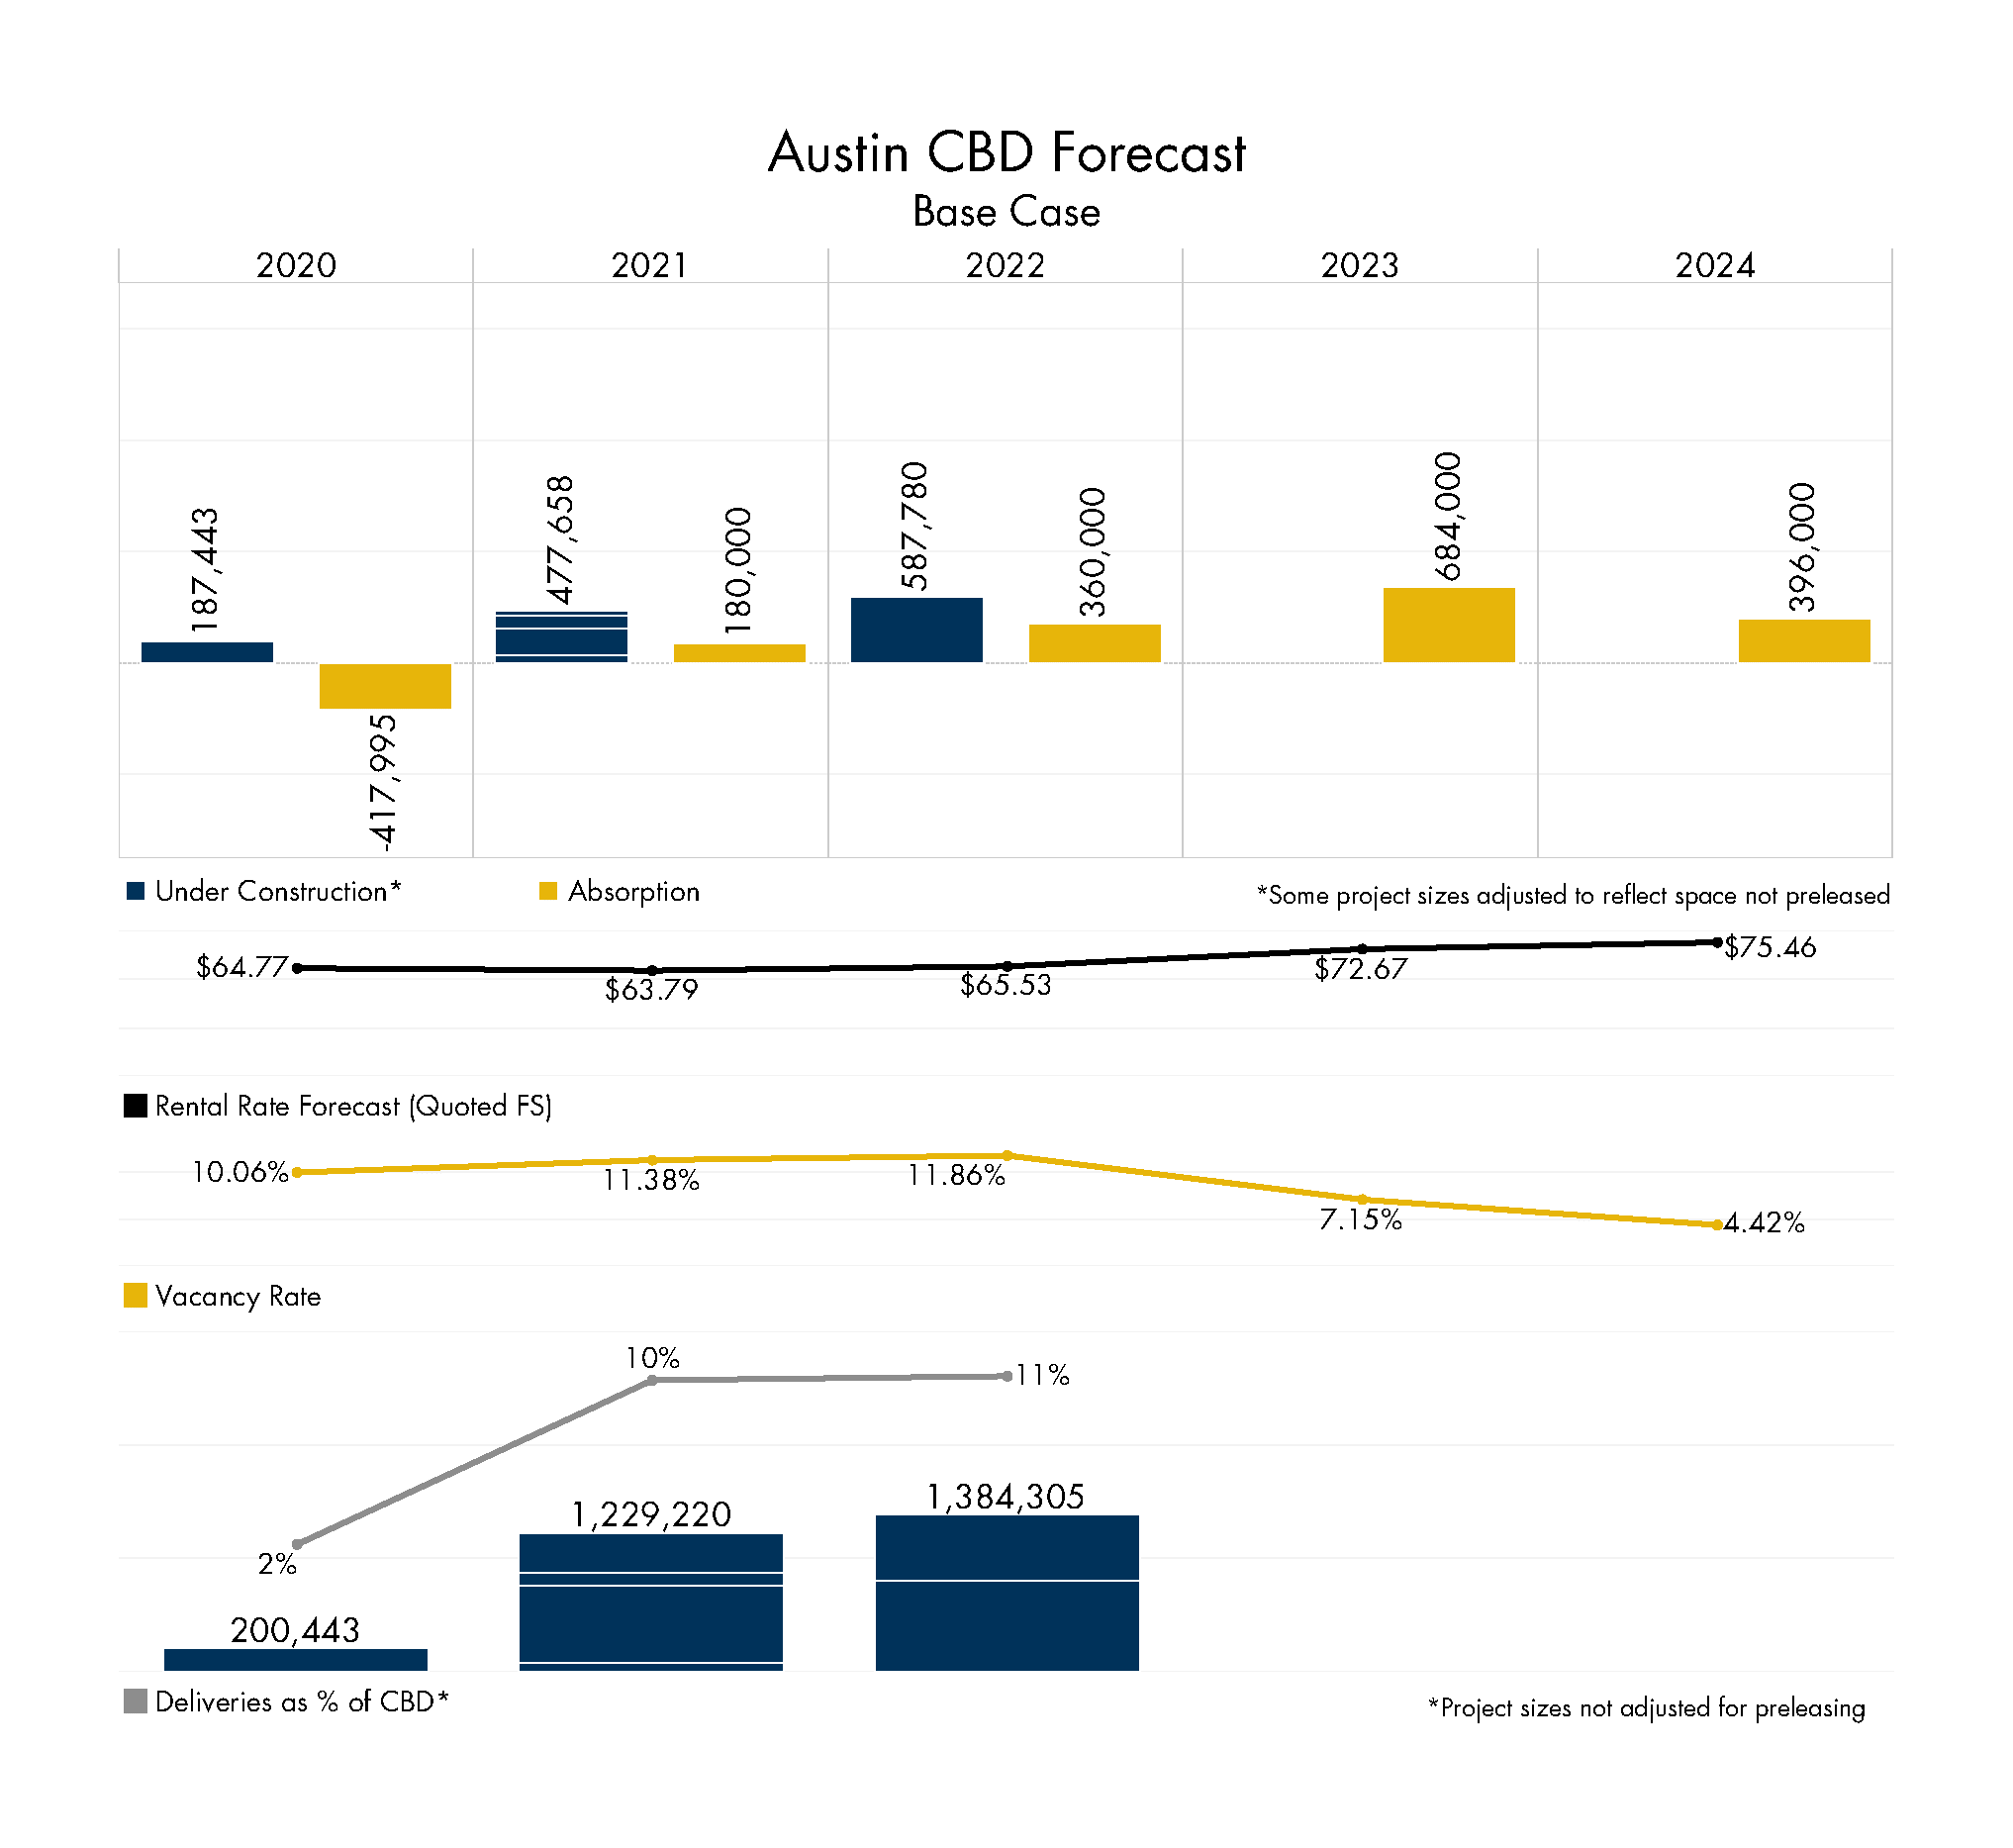
While we expect job growth to trend upwards over time, we also anticipate there will be a change in future absorption as tenants reevaluate their space needs as a result of COVID-19. Whether this will lead to tenants leasing more space to accommodate greater social distancing or result in tenants leasing smaller spaces due to employees working from home is still unclear.
For the sake of our Base Case, we take the middle road and assume both outcomes are equally likely and will, effectively, cancel each other out, thus not having a substantial impact on absorption trends as we understand them today.
As you can see, while this scenario shows negative absorption in 2020 and an increase in vacancy, rental rates are expected to remain relatively steady due to the forecasted job growth. If this scenario becomes reality, we could see a slightly more vacant but still relatively healthy downtown office market.
Downside
This scenario is modeled to reflect market conditions similar to those experienced in the years following the Dot-Com Bust (post-2000). It assumes negative job growth in the Austin-Round Rock MSA for two years followed by a gradual increase back to the historical five-year average. As with the Base Case, this scenario also assumes a jump in sublease availability, but goes a step further and assumes roughly 300,000 square feet (about 50%) of coworking space downtown will go into default in 2020.
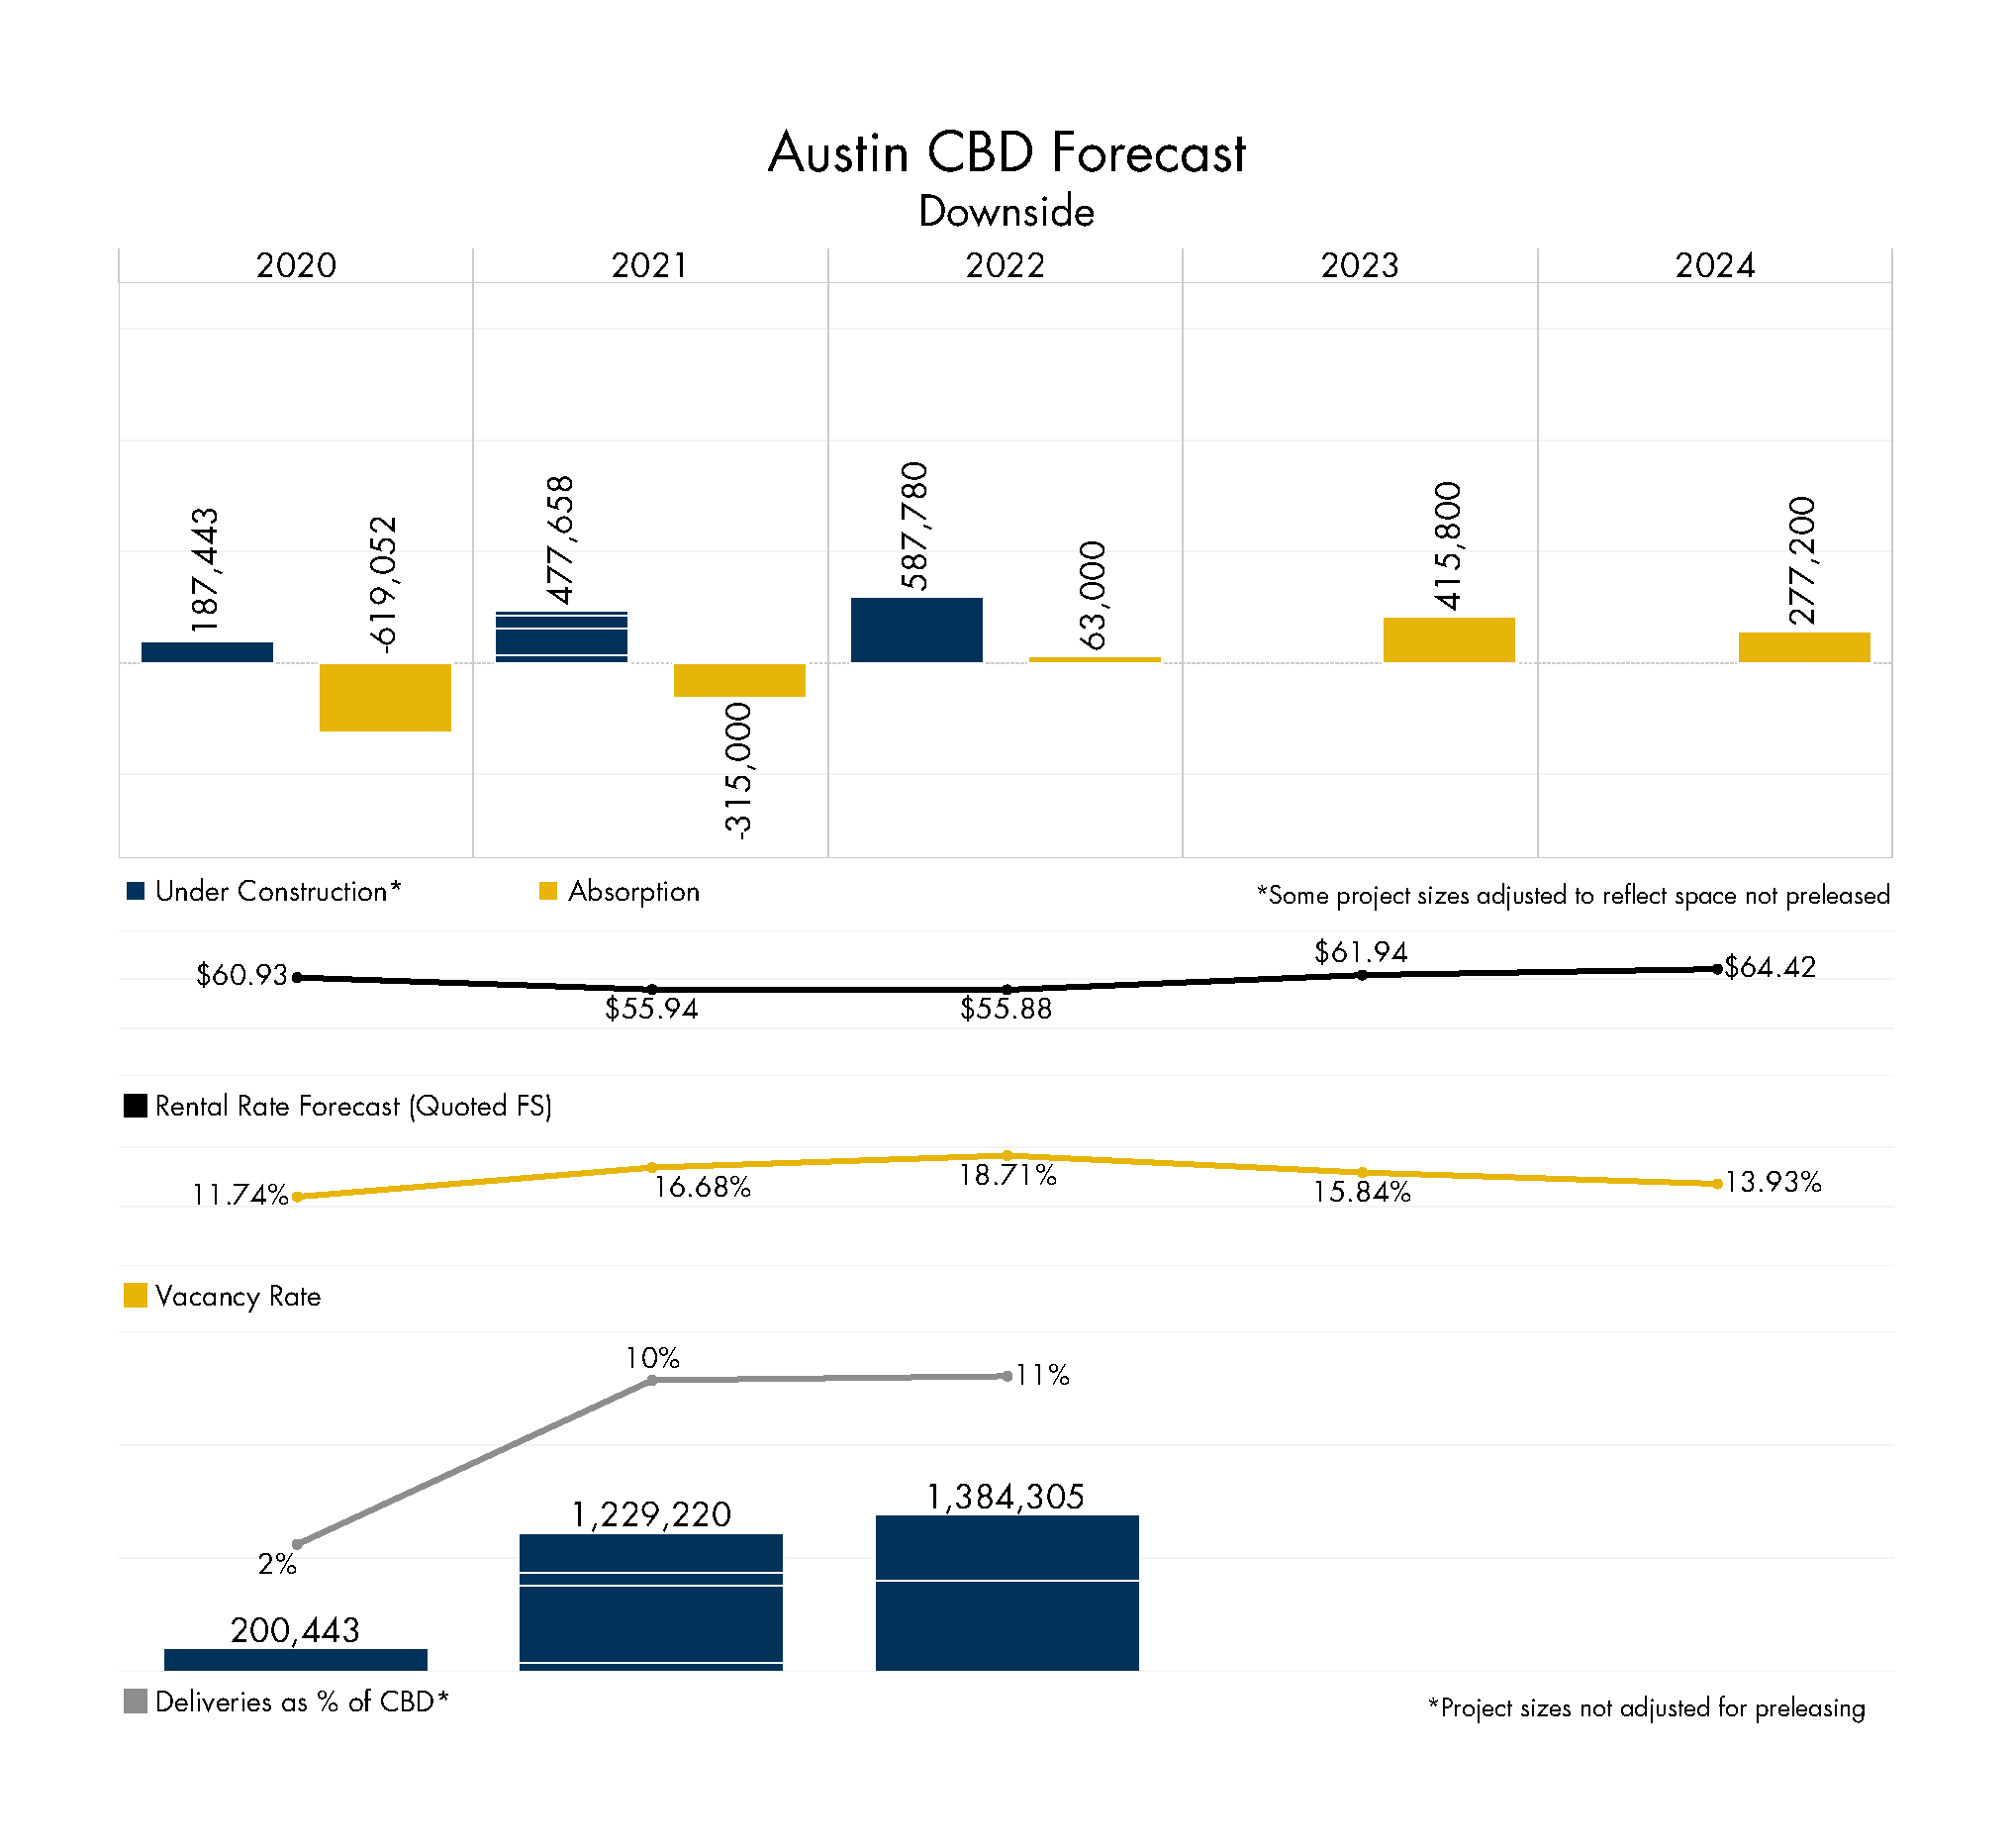
We also assumed that the majority of CBD office tenants under this scenario will opt to downsize and encourage employees to work from home, leading to less absorption than job growth numbers would have indicated historically.
To do this, we estimated that 30% of the downtown office workforce would continue working from home long-term post-COVID-19. This would mean that a company with 100 employees would only have 70 in the office. Assuming the company had a 20,000-square-foot office before COVID-19, it would now only “need” a 14,000-square-foot office post-COVID-19 assuming it maintains a density of 200 square feet per employee in the office. Dividing 14,000 square feet by their actual employee count (100) results in a density of 140 square feet per employee. This indicates a company growing under this scenario would account for less absorption than it would have before COVID-19.
In this scenario, the mix of negative net absorption for two years combined with negative and slow job growth results in a noticeable decline in full-service rates and a sharp and sustained increase in vacancy.

In the downside scenario, we assumed that the majority of CBD office tenants will opt to downsize and encourage employees to work from home, leading to less absorption than job growth numbers would have indicated historically.
Upside
Our upside scenario is modeled to reflect a “V” shaped recovery. We assume 0% job growth in 2020 followed by 3% in 2021, 3.5% in 2022, 3.2% in 2023 and 2.3% in 2024. We also assume that sublease availability remains steady at 2% of the CBD market and that no coworking space goes into default downtown.
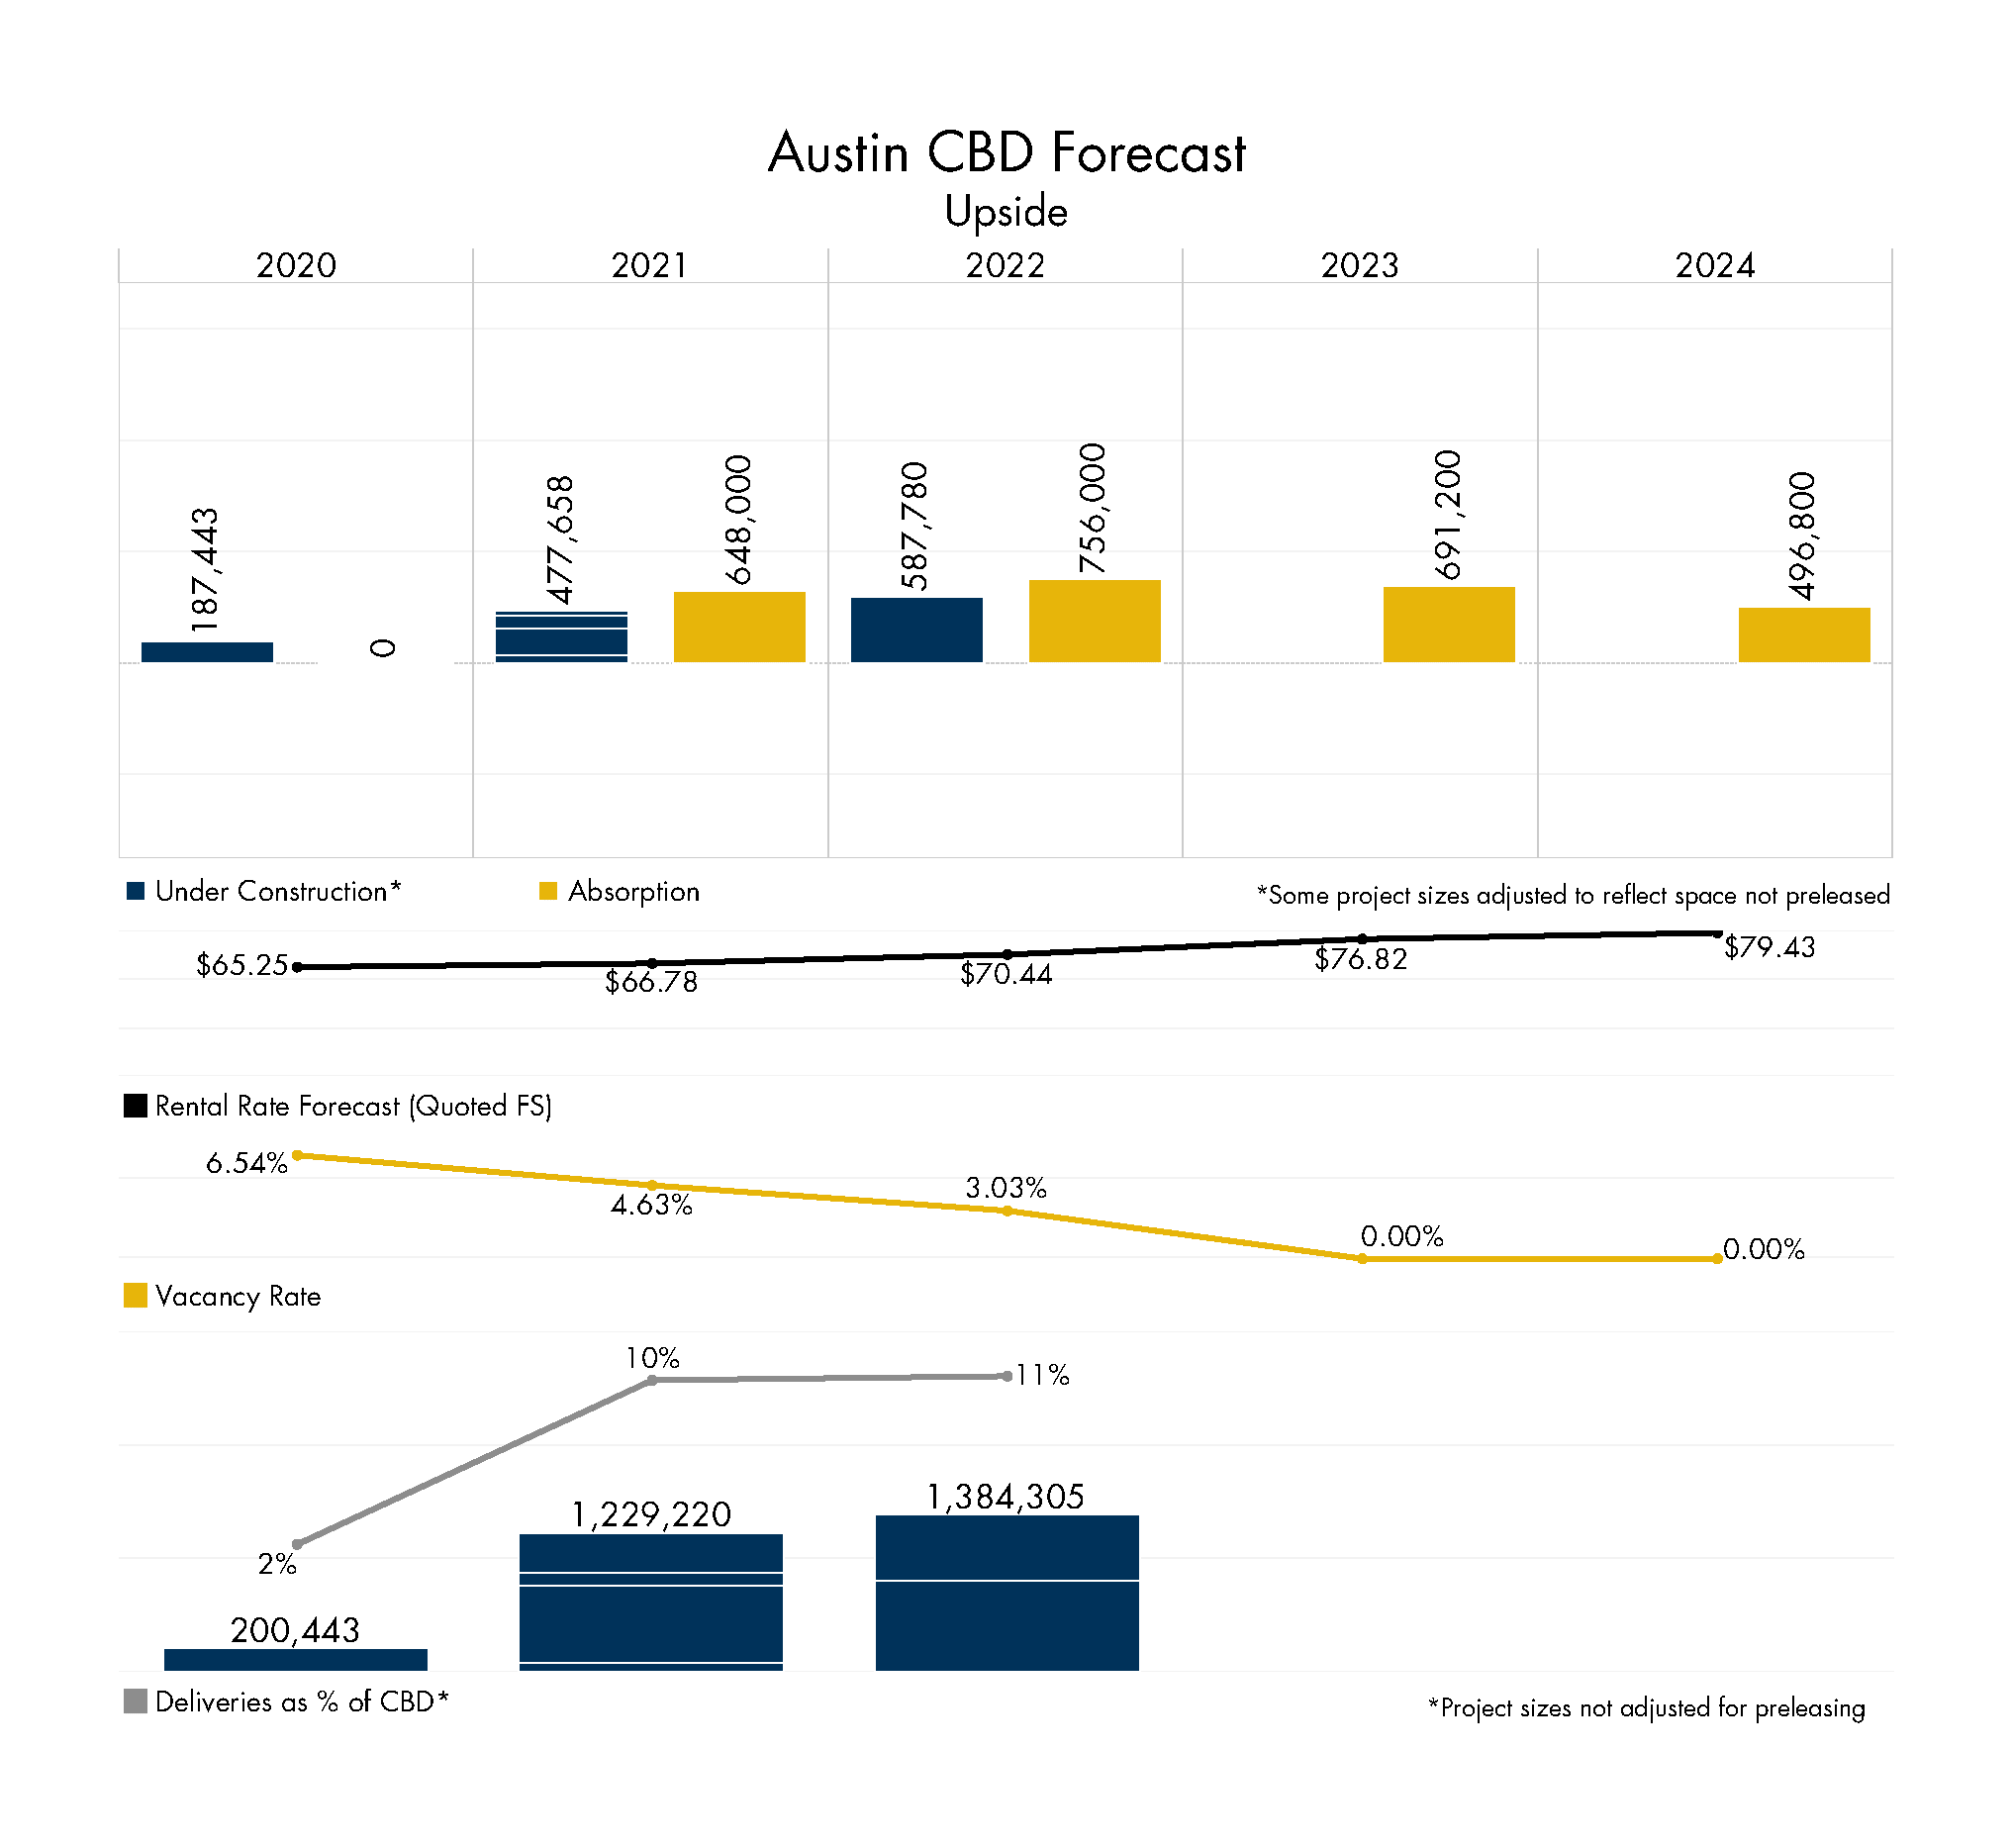
For this scenario, we also assume that the majority of tenants would opt to decrease density by occupying more space. In this case, job growth numbers would indicate a higher volume of absorption than they would have previously.
To do this, we assumed average office density downtown would increase to 240 square feet per employee, meaning that a tenant would need to lease more space to house the same number of employees. We estimated this density number based on historical national density averages prior to the open floor plate and dense layouts we see today.
Total Occupied Square Feet per Worker (U.S.)
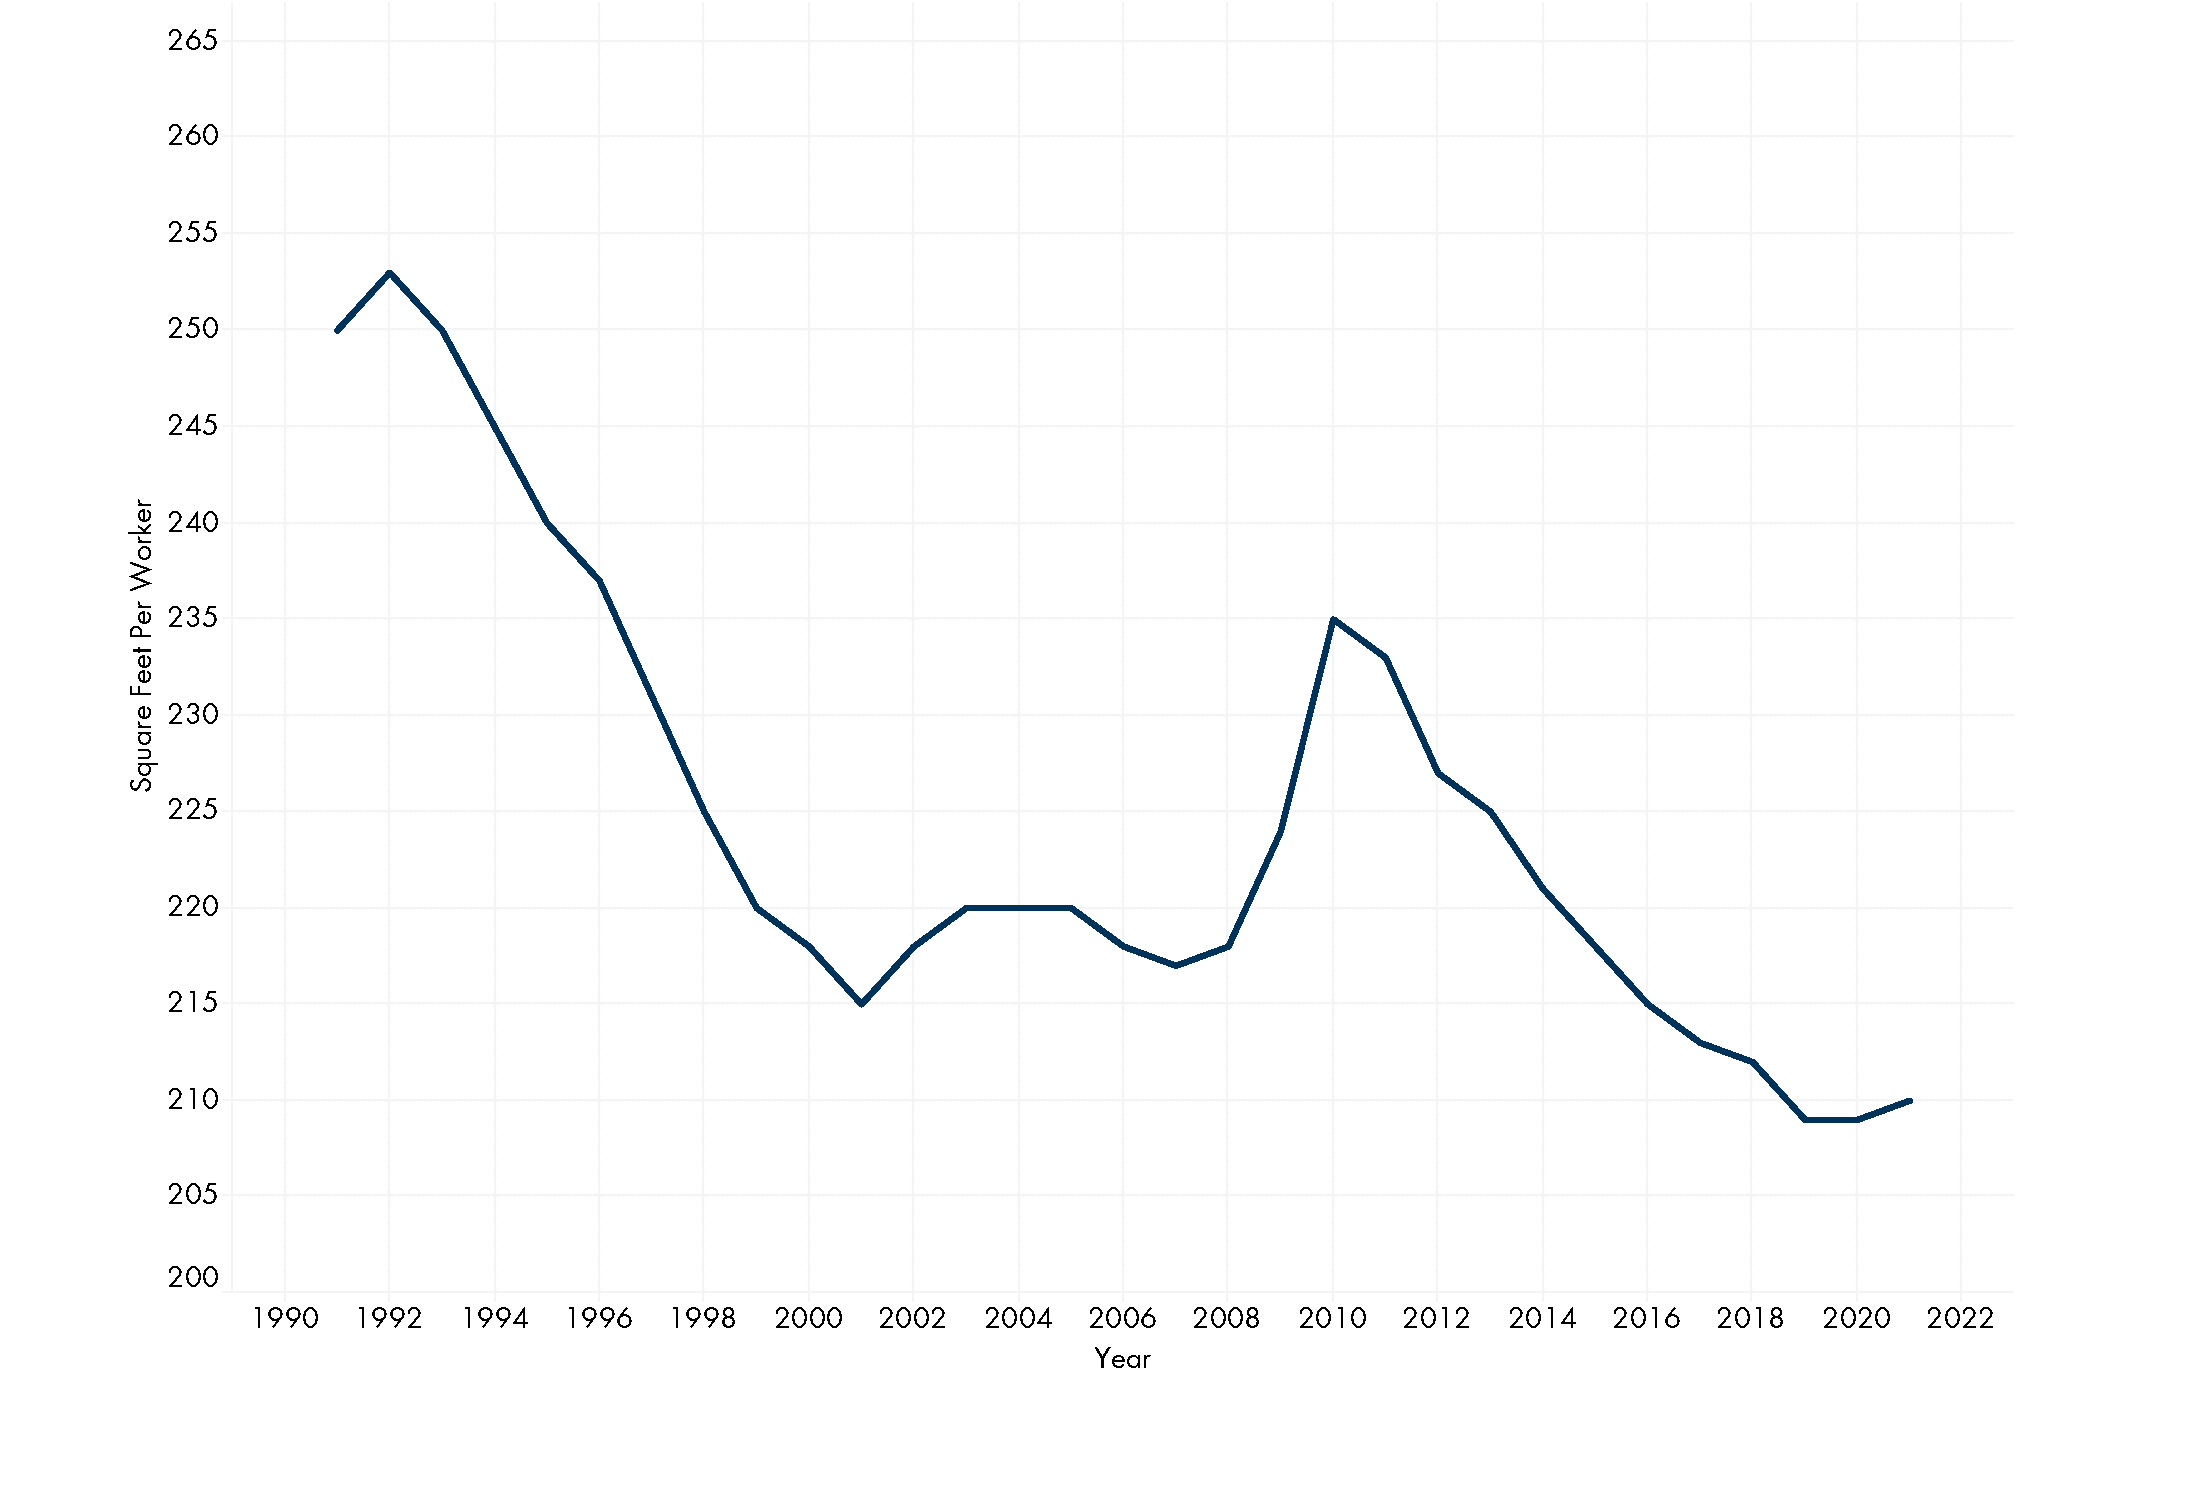
Source: CoStar Portfolio Strategy
As expected, this scenario forecasts a CBD market with increasing rental rates and strong positive absorption. Vacancy rates hitting 0% by 2023 are a strong indication that developers would likely be encouraged to break ground on a new project if this outcome were to come true.
Our Methodology
In order to design this tool, we spent a considerable amount of time looking at different variables to determine which ones yield the most defendable, statistically accurate results.
Through this process, we settled on the following methodologies.
Development Pipeline and Absorption
For this analysis, deliveries are based on our development pipeline located on page 28 of our 1Q 2020 Austin Market Report, which we update quarterly.
| Year | Building Name | Total SF | SF Adjusted for Preleasing | Status |
| 2020 | 405 Colorado | 200,443 SF | 187,444 SF | Under Construction |
| 2021 | 701 Rio Grande | 120,000 SF | 120,000 SF | Under Construction |
| 2021 | 300 Colorado/Parsley Tower | 358,000 SF | 44,173 SF | Under Construction |
| 2021 | The Quincy | 77,782 SF | 77,782 SF | Under Construction |
| 2021 | Indeed Tower (200 W 6th) | 673,438 SF | 235,703 SF | Under Construction |
| 2022 | Block 185/Google Tower | 796,525 SF | 0 SF | Under Construction |
| 2022 | 6th x Guadalupe | 587,780 SF | 587,780 SF | Under Construction |
For projects currently under construction that have successfully preleased space, we have adjusted their square footage to reflect only the space still available. For example, if a project is 200,000 sf but has preleased 50% of its space, it will display as 100,000 square feet in the top bar chart.
Our absorption forecast uses the historical relationship between absorption in Austin’s CBD and job growth in the Austin-Round Rock MSA. We modified this relationship for our Downside and Upside Scenarios to reflect potential office density outcomes post-COVID-19. We have carried these relationships forward to work in conjunction with our job growth assumptions.
Vacancy and Rental Rates
Our vacancy forecast is based on the CBD’s vacancy as of 4Q 2019 combined with the delta between forecasted square feet delivered and square feet of absorption. For example, if more square footage is delivered than absorbed, our model will forecast an increased vacancy rate.
Read Now: What Are Vacancy Rates in Austin, Texas?
The full-service rate forecast is based on a regression using historical data from 2004 to 2019. This regression has been accurate within 2% of actual market rates since 2004.
For those more statistically inclined, the regression’s adjusted R Squared value is .96 and its F test comes in well below a 5% level of significance, so we have every reason to believe that this model is not only historically accurate but statistically accurate enough to use for forecasting when employing accurate inputs.
Deliveries as a Percent of the CBD
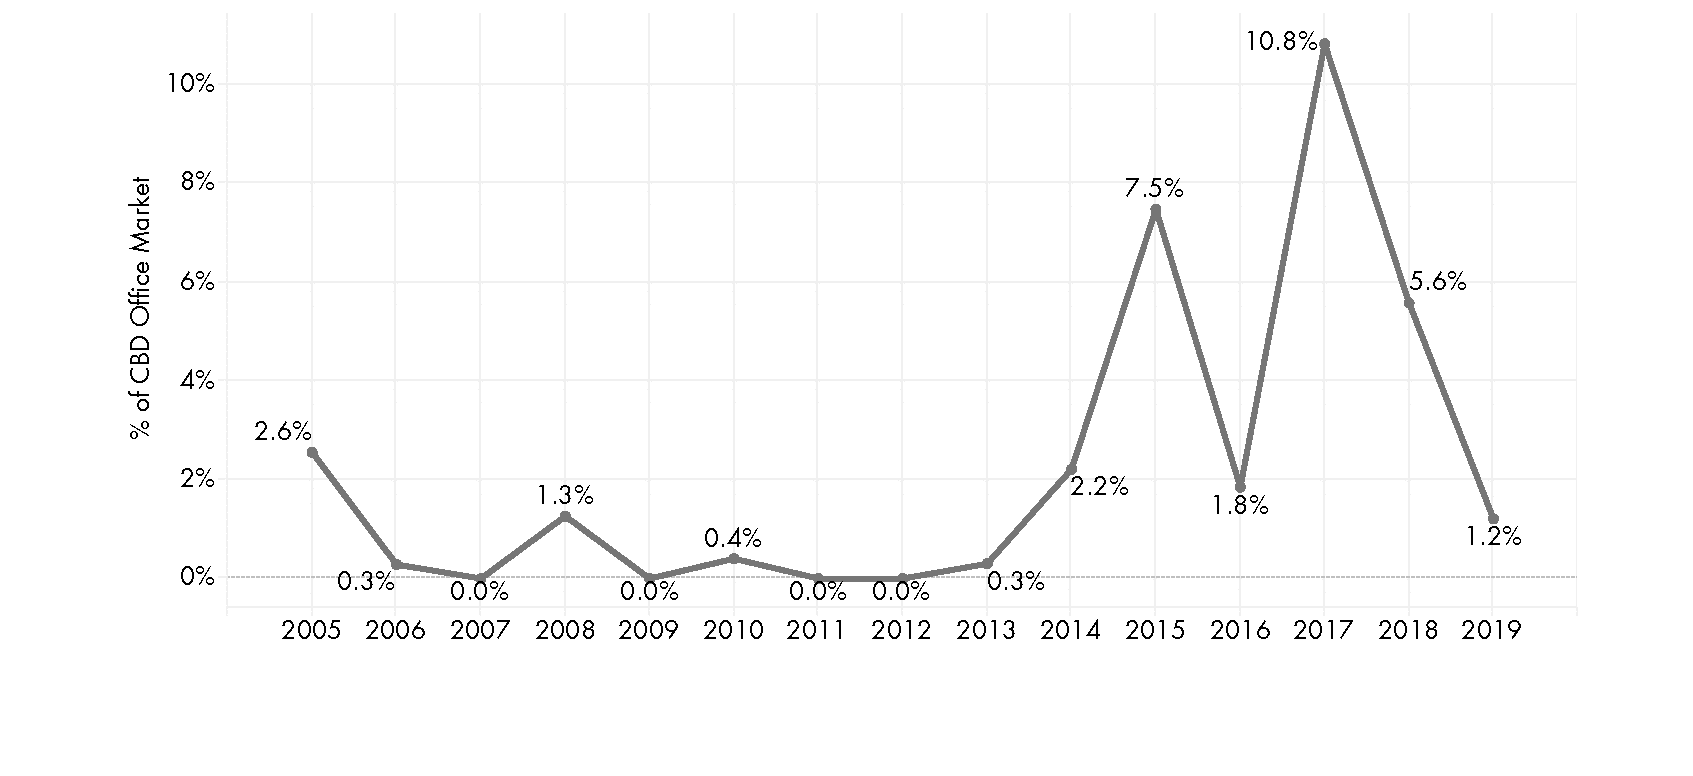
We also felt a useful indicator to include in this analysis would be to show what percentage of the CBD’s total square feet of office space would be made up of deliveries in a given year. To do this, we calculated the total square feet delivering and divided it by the CBD’s total square footage the year prior. Under construction projects that were adjusted for preleasing were included at their full square footage to calculate this percentage.
For reference, historically, annual deliveries have only accounted for 2% of the CBD on average since 2004 and 5.4% on average since 2015, so the current development pipeline indicates that there will soon be much more development competition than there has been in the past.
Deliveries as a Percent of CBD Office Market
Historical Perspective
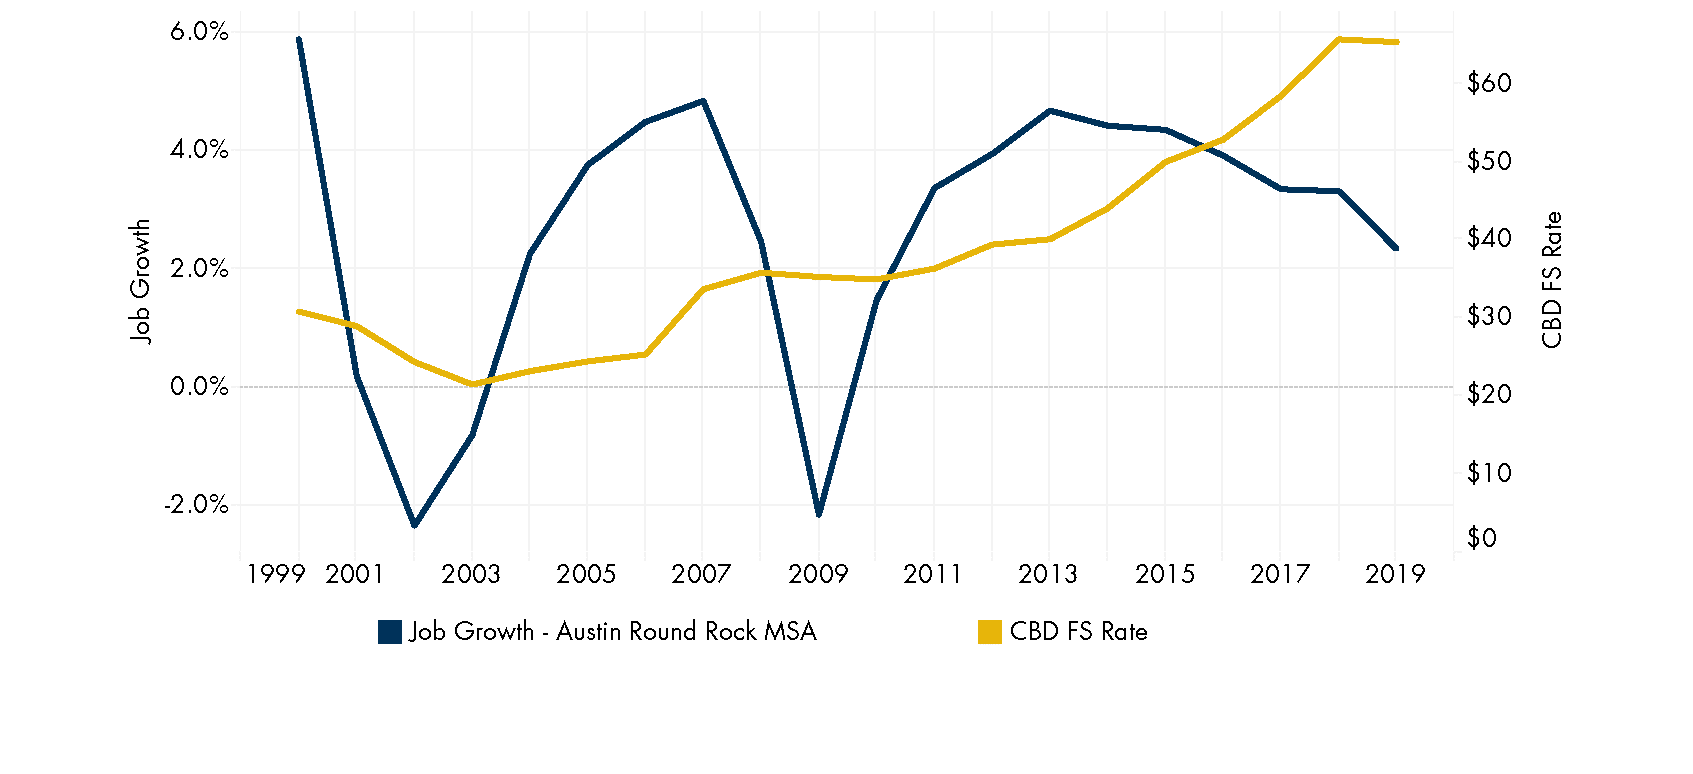
For reference, below is how job growth and full-service rental rates in Austin’s CBD have performed after the last two recessions.
Job Growth & CBD Full Service Rental Rate
Read Now: How Much Does It Cost to Lease Office Space in Austin, Texas? (Rental Rates, Pricing)
Conclusion
The primary purpose of this analysis is to provide a glimpse into what the future of Austin’s CBD submarket could look like given what we know today. While no forecast is able to predict the abnormal events that sometimes take place, like Google fully committing to Block 185 or a major anchor tenant suddenly terminating its pre-lease, this model does provide a useful starting point.
We are at a fluid point in time. With such a wide possibility of outcomes in front of us, flexible and thoughtful business planning for landlords and tenants has never been more important. AQUILA, as always, is here as a resource as you take on the important work of navigating the landscape ahead.
Download our latest Austin Office Market Report to learn more.
