What does the economic landscape of Austin, Texas look like today? In this article we explore both where we stand today and how we compare to the past.
Our exploration is two-fold, delving into:
- The intricate web of macro and microeconomic trends
- Analyzing the ever-evolving world of Austin’s commercial real estate market.
Macro and Micro Economic Trends
There are countless economic trends we could analyze to better understand the state of the market. For this article, we decided to focus on the most relevant trends to the people and companies calling Austin home. The following elements are the ones we consider to best represent our past and present.
Read Next: What Are Operating Expenses for Office Space in Austin, Texas?
Unemployment Rate
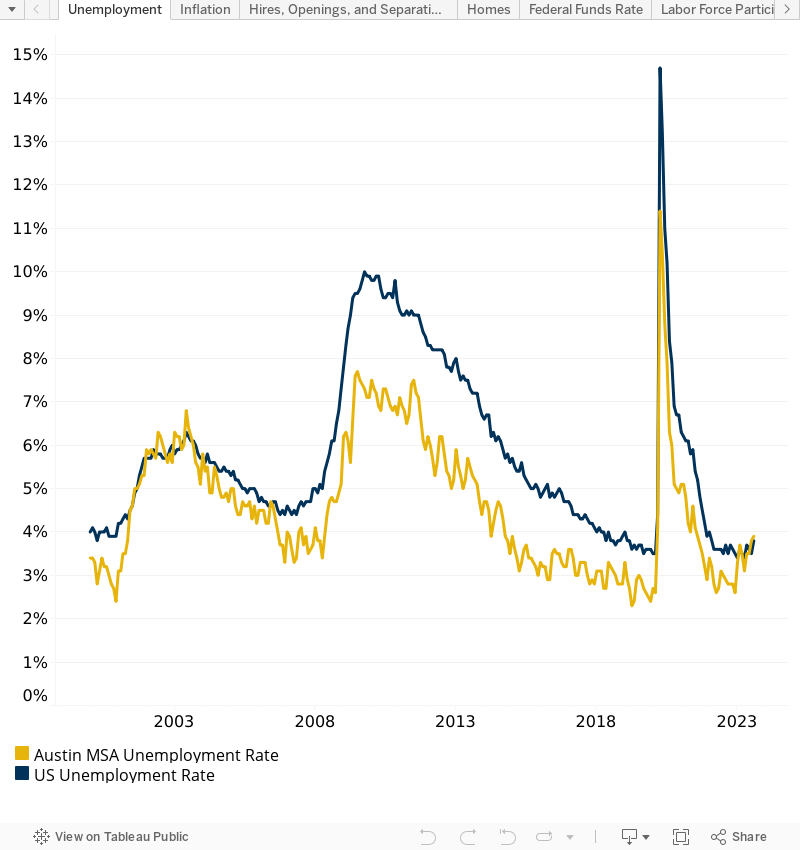
The unemployment rate is an oft-cited economic benchmark and is arguably one of the most easily understandable variables. In most cases, the higher the unemployment the worse the economy is doing.
In the chart below, you can see that the Austin MSA’s unemployment rate is currently almost exactly the same as the U.S.’s rate. This correlation is a reversion to the rates seen between 2001 to 2006 when Austin also shared almost the exact same unemployment as the country. But, prior to the COVID-19 pandemic, Austin usually had lower unemployment than the U.S. average, so this reconvergence is an interesting period for the Austin market.
Inflation Rate
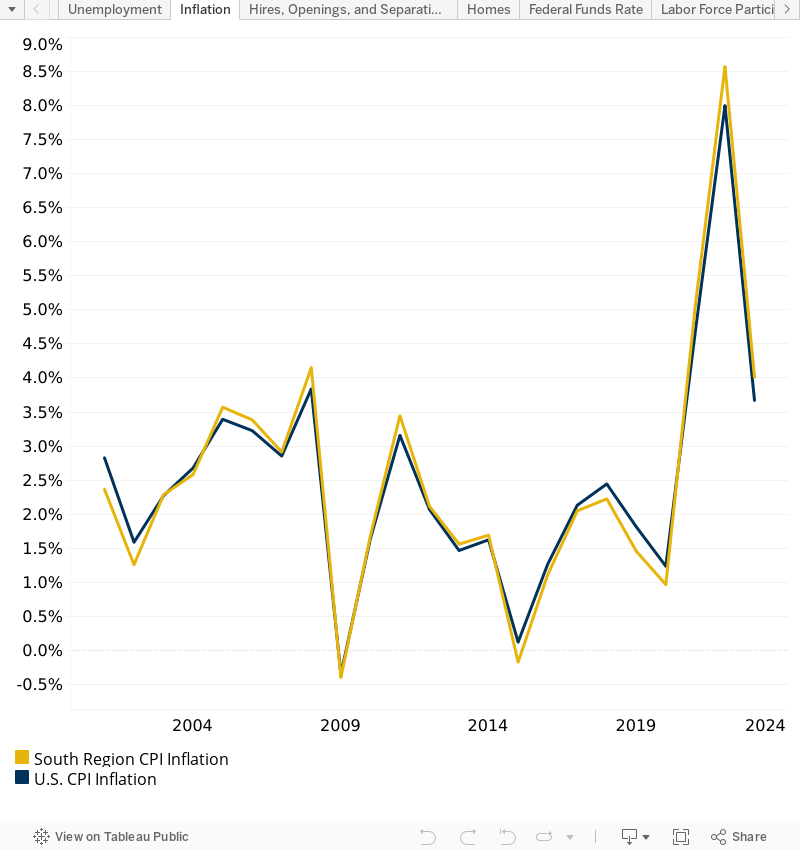
The inflation rate is another common economic indicator, one that we have all become far too familiar with over the last year or two. While some inflation can be good for the economy, too much can quickly make life too expensive.
The U.S. inflation rate has historically remained very close to the South Region’s inflation, and today is no different. Both rates sit at roughly 4% year-over-year (YOY) today. Although higher than the inflation seen over the past decade, today’s inflation is well below the spike of over 8% seen in 2022.
Hires, Openings, and Separations
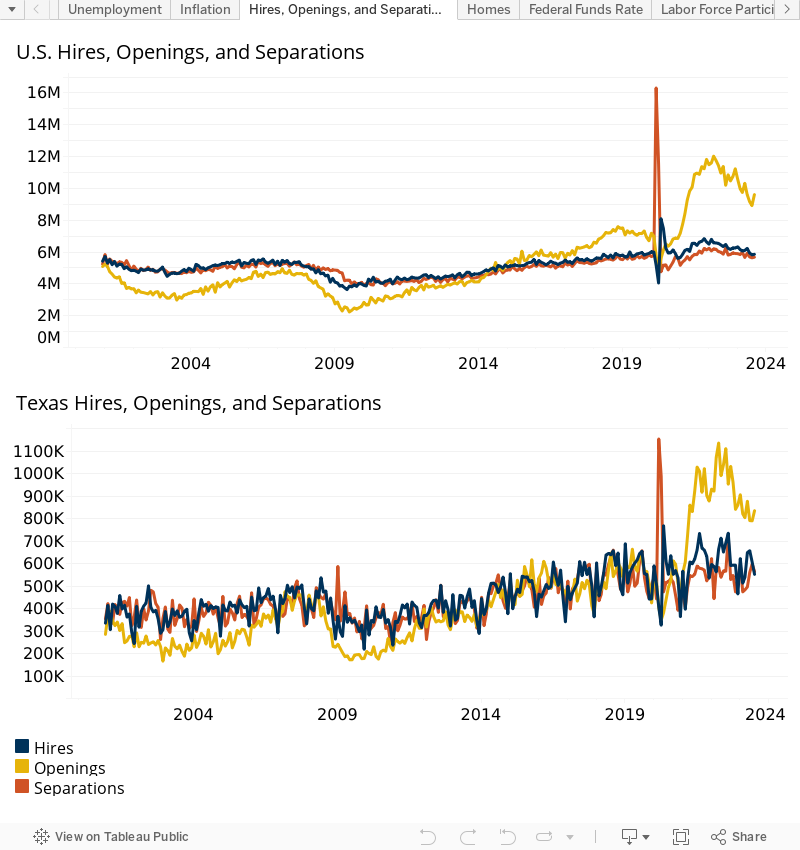
The Bureau of Labor Statistics closely tracks the number of people hired, job openings posted, and people leaving their jobs each month. By utilizing this data, we can gain valuable insights into the job market’s strength.
Read Next: Why Texas Is a Great Place for Your Business
The charts below show both the U.S. job market as well as the Texas market. As you can see, these three lines have historically remained relatively close together, occasionally swapping positions but generally seeing no significant jumps or changes.
This changed in March 2020, when separations skyrocketed due to the COVID-19 pandemic. Since then, an interesting job market has developed with the number of job openings far exceeding the number of hires and separations. A delta this large between these two lines has never been seen over the time frame of our data set. What this could mean over the long term is yet to be seen.
Labor Force Participation Rate
Another useful indicator to gauge the relative health of the labor market is the labor force participation rate. This rate shows us how much labor is available at any given time. This data point is defined by the Bureau of Labor Statistics as the percentage of the noninstitutional population 16 years and older that is working or actively looking for work.
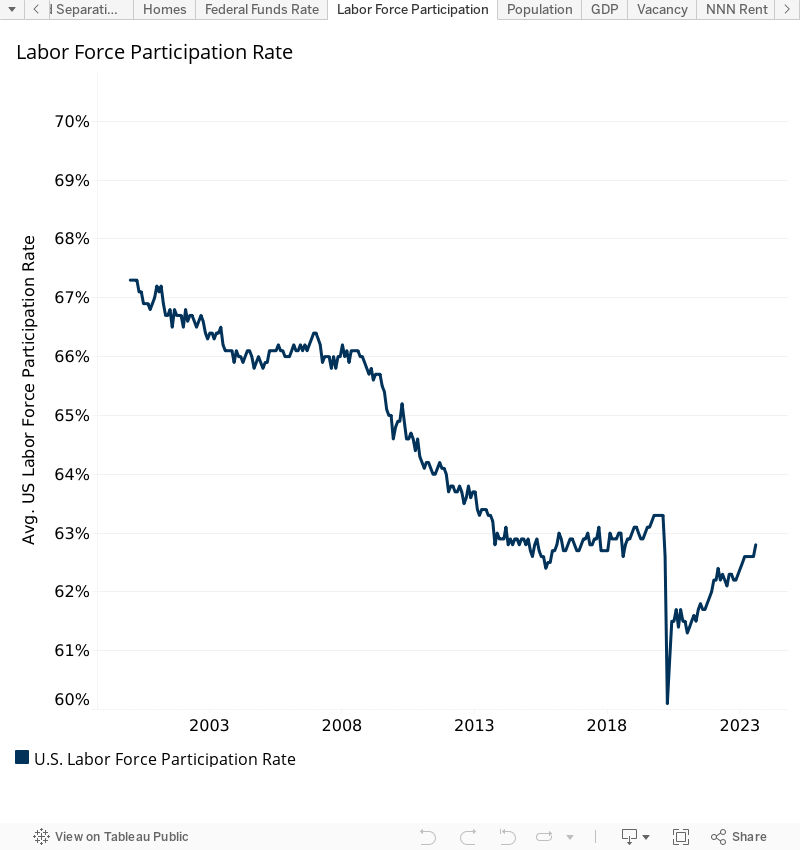
As you can see, participation has been on a steady downward trend for some time. Other than a slight plateau between 2004 to 2008 and another between 2015 and 2019, the only other significant change in this trend was the drastic drop off of participation in April 2020 caused by the pandemic. Since that drop, the participation rate has been trending upward but has still not reached its pre-pandemic level.
While we are only talking about a difference of roughly seven percentage points between the peak and trough in our data set, a decreasing labor force participation rate is typically viewed negatively in macroeconomic terms. With fewer people working relative to the greater population, GDP can be slowed and production can decrease.
Home Prices
Everyone knows home prices have shot through the roof over the past few years, but have prices really gone up that much compared to historical YOY changes? The chart below would say yes.
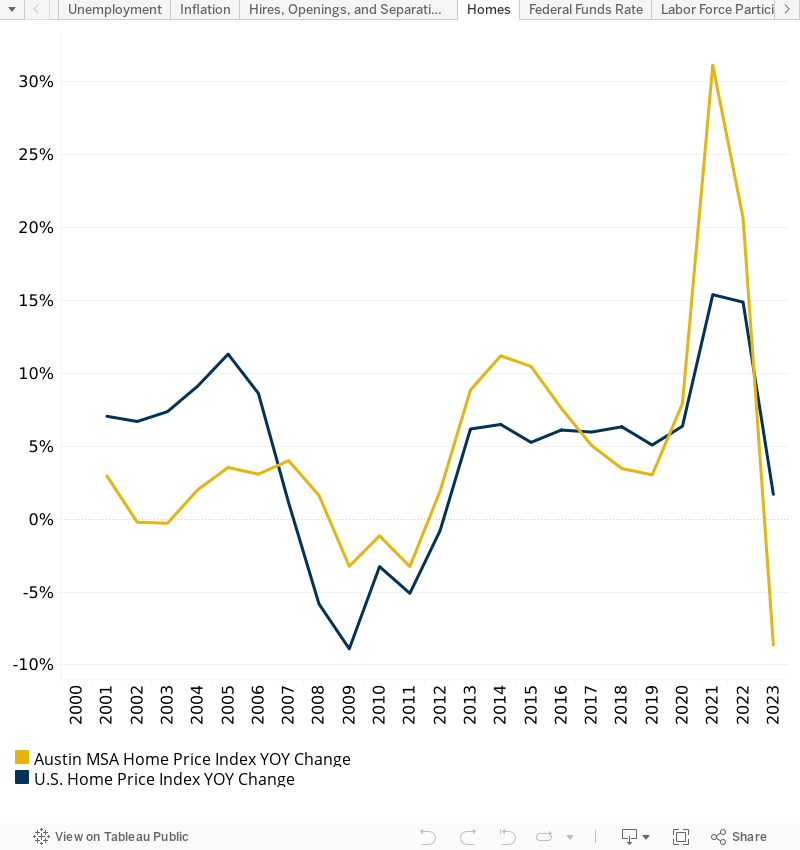
The home price index for the Austin MSA increased over 31% in 2021, by far the largest YOY change in our dataset. The same can be said for the U.S. index, although not quite to the same degree. Though the Austin index has experienced a decrease in 2023, home prices in Austin continue to be one of the biggest affordability challenges for the area.
Read Next: Why Austin, Texas Is One of the Best Cities in America
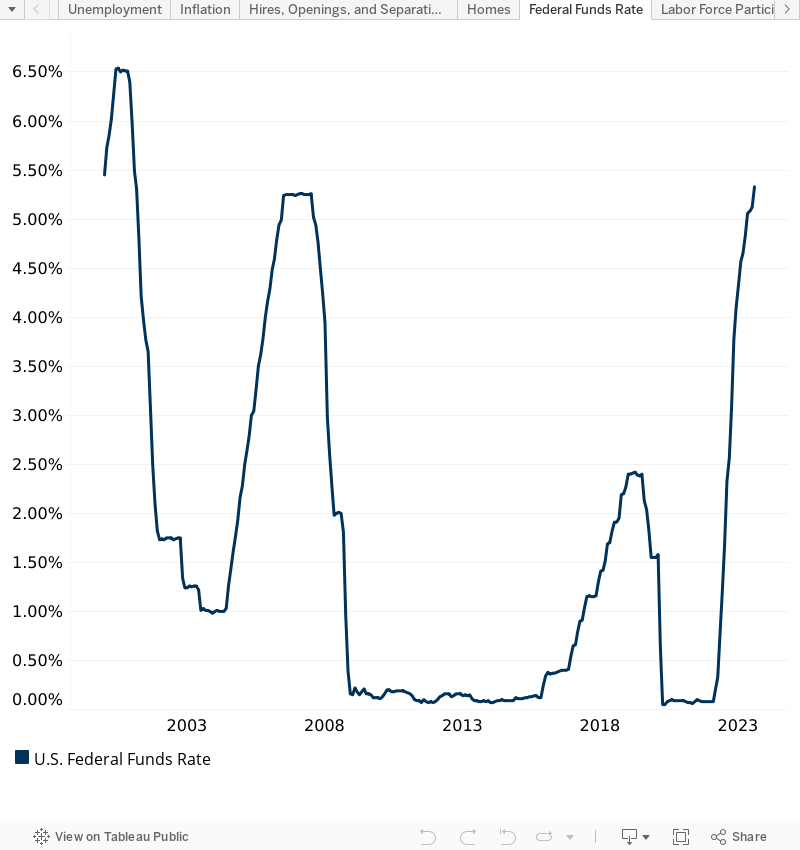
Federal Funds Rate
This macroeconomic variable may not impact people directly in their day-to-day lives, but the consequences of changes to the Federal Funds Rate do.
The Federal Funds Rate currently sits at 5.33% as of August 2023, a result of the Federal Reserve trying to slow down the inflation seen in 2022. Today’s rate is almost the exact same as seen in 2007 and is lower than the peak of 6.53% seen in 2000 during the dot-com bust. The Fed is still closely monitoring the inflation situation and is unlikely to drop the Federal Funds Rate back down in the foreseeable future.
Austin’s Commercial Real Estate Market
Now that we’ve covered the economic trends, let’s analyze the trends happening in Austin’s commercial real estate market.
For this analysis, we’ve pulled all data from CoStar using the Austin MSA as our boundary. Each property type includes aggregated data from all properties of that type, with no filters for size, class, or other variables.
Vacancy Rates in Austin
Vacancy rates have become a hot topic in the Austin CRE market lately because, like most markets in the country, they have been increasing. But not for every property type.
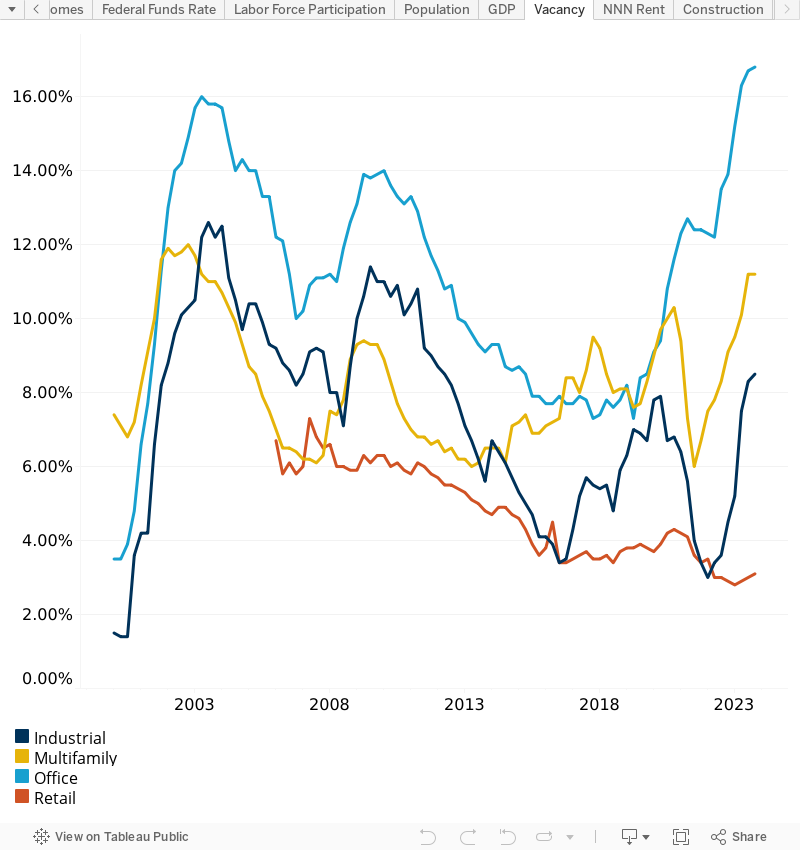
Vacancy for office buildings in Austin has increased dramatically since early 2020. The rate of 8.3% seen at the end of 2019 has now increased to 16.8% today, largely due to the rise in remote work and the overall uncertain future of office space.
Both multifamily and industrial vacancy had the opposite trend post-2020, dropping dramatically for a number of quarters in a row, but have now reverted to their 2019 levels. And, as you can see, retail vacancy continues to trend even lower.
Read Next: What Are Vacancy Rates in Austin, Texas?
Speaking specifically for office and industrial, the vacancy rates being seen today are very similar to those experienced in the early 2000s following the dot-com bust. These two product types have been hit the hardest by the tough economic conditions referenced above.
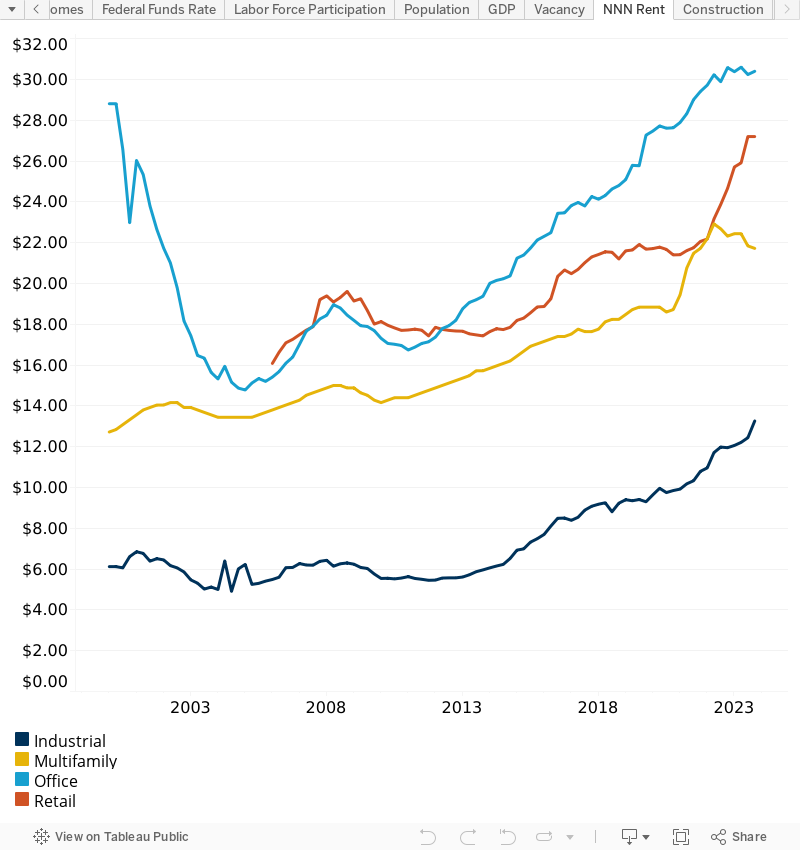
Rental Rates in Austin
Despite rising vacancy, asking NNN rental rates in Austin have continued a steady climb upward and were largely unimpacted by the pandemic. The exception to this trend is in the multifamily sector, where asking rates have dropped from their peak of $22.92 in 2Q 2022 to $21.72 today. While a slight relief to Austin’s renters, today’s multifamily rent still remains above the 2020 average.
Construction as a Percentage of the Market
Another less cited but equally important indicator of market health is comparing the volume of new space under construction to the amount of existing space in the market. A high percentage should indicate that developers anticipate there to be a significant amount of future demand for the type of space they are building, and a low percentage should indicate that developers are uncertain about future demand.
Read Next: Downtown Austin Towers and Developments (Under Construction and Proposed)
The chart below shows that new construction is at, or near, all-time highs for every property type. Industrial and multifamily projects have seen a remarkable uptick in construction, leading to the creation of unprecedented volumes of space. And while not at all-time highs, office and retail construction is still relatively elevated compared to the historical average.
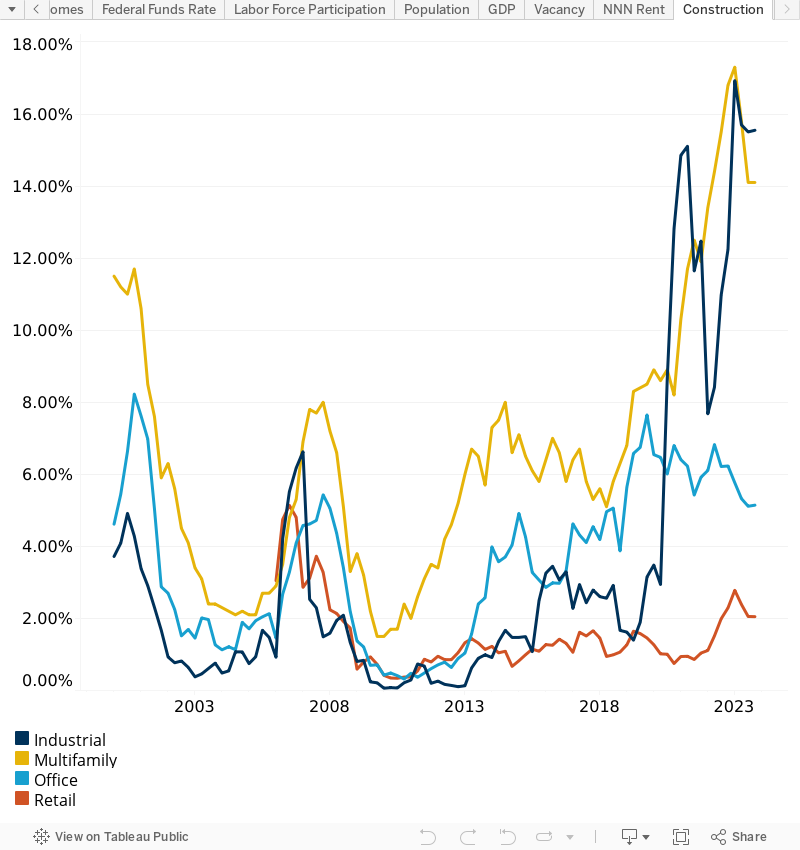
While a high volume of new construction can be good, it can also be worrisome if that new construction is not quickly filled once it is delivered. Only time will determine whether this unfolds, or if Austin’s vacancy rates will continue their upward trend due to delays in filling these developments.
Conclusion
In conclusion, our in-depth analysis of Austin’s economic landscape and commercial real estate market reveals a complex and ever-evolving picture.
These intertwined economic and real estate trends paint a dynamic and complex landscape for Austin’s future, making it essential for stakeholders to adapt and strategize effectively in this evolving environment.
If you’d like to learn more about the Austin Office Market, check out these articles:
- How Much Does It Cost to Lease Office Space in Austin, Texas?
- What Are Typical Tenant Improvement Allowances in Austin, Texas?
Download our latest Austin Office Market Report to get the full story on the rental and vacancy rates, large leases and major property sales, the city’s development pipeline, and more.