This article was originally published in AQUILA’s 2Q 2018 Austin Office Market Report and will not be updated. Please contact us if you have specific questions regarding the information in this article.
With so much development underway in Austin and rental rates reaching record highs, competition for office space remains fierce. So fierce, in fact, that many tenants are electing to pre-lease space in new developments rather than waiting and hoping for second-generation space to become available.
In this article, we take a deep look at speculative development and pre-leasing trends in the Austin office market.
How Common Is Pre-Leasing in Austin?
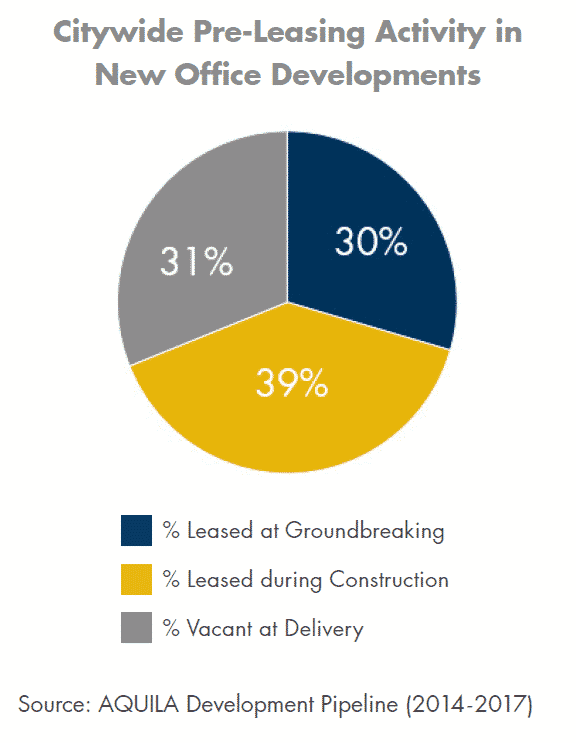
Using these buildings, we began by looking at the Austin-wide trends for pre-leasing in three different categories: percent of square feet leased prior to groundbreaking, percent leased during construction, and percent vacant at delivery.
From these initial numbers, you can see that 69% of space in our building set was leased before the buildings delivered.
Next, we broke down pre-leasing trends across the three primary submarkets to see if any differences or trends emerged.
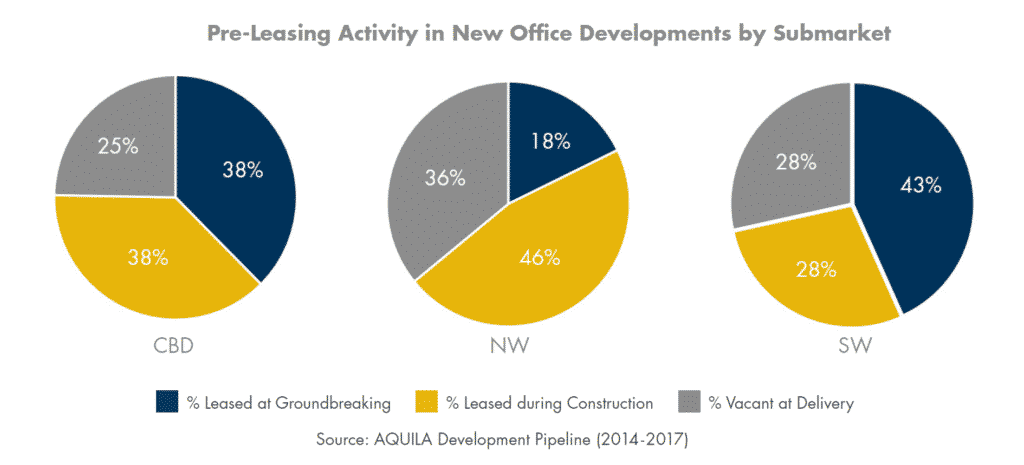
Surprisingly, it turns out there were no major differences in pre-leasing activity between the submarkets – despite varying rental rates and amenities present in each.
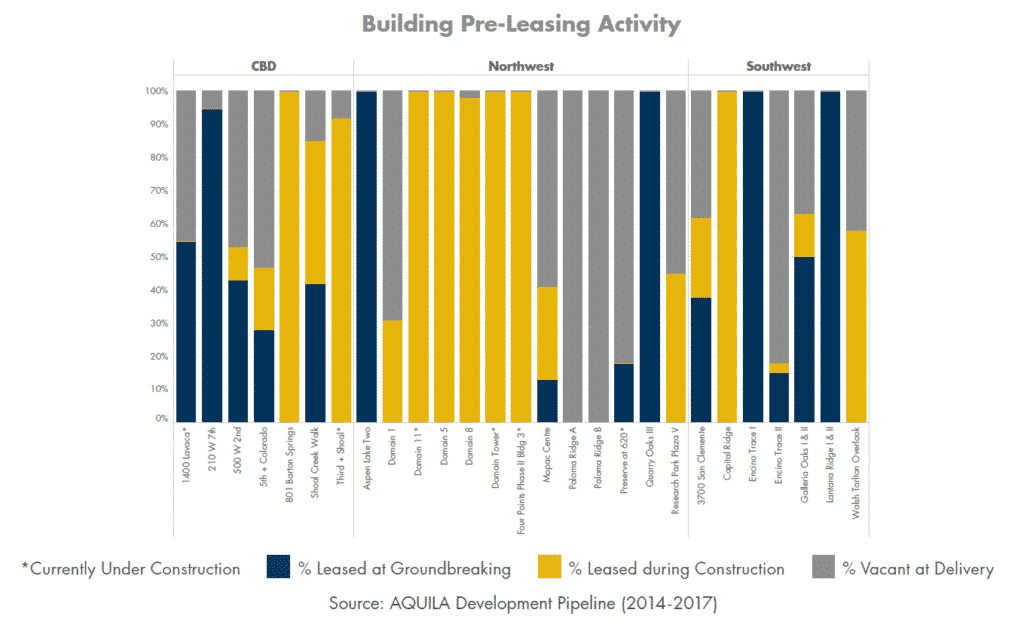
Above you can see the individual buildings responsible for these percentages broken out by submarket.
Spec or Pre-Leased?

Using the same 27 buildings in our original analysis, we also wanted to look into the number and size of buildings being developed as spec projects versus pre-leased developments.
For simplicity, we considered a spec development as one with 0% pre-leasing at groundbreaking and a pre-leased building as one with some amount of pre-leasing at groundbreaking. We also filtered out the buildings currently under construction because they still have the potential to lease more space before delivery.
After employing these filters, we were left with 21 buildings. We found that eight of the 21 developments delivered were speculative, while 13 had at least one tenant signed at groundbreaking.
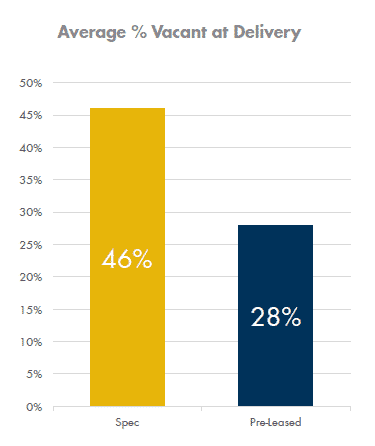
Of the eight spec buildings, two were completely leased prior to delivery, compared to four in the pre-leased set.
To the right, you can see the difference in vacancy at delivery between the spec and pre-leased developments. Interestingly, while spec buildings accounted for 38% of new developments, they accounted for only 30% of the total square footage delivered. The eight spec buildings accounted for 1,151,295 square feet, while the 13 pre-leased buildings accounted for 2,644,554 square feet, a difference of nearly 1.5 million square feet.
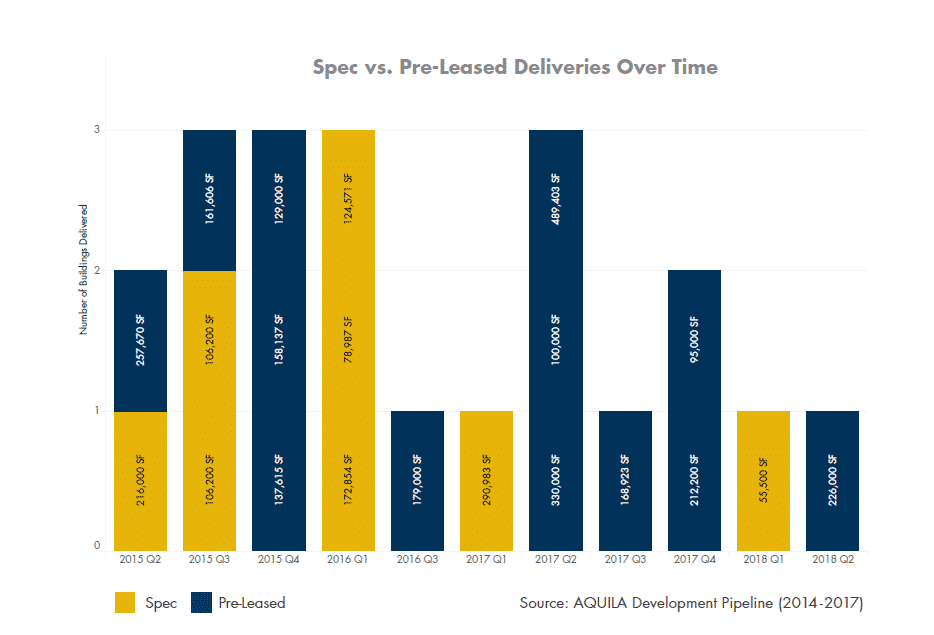
To look at this another way, these numbers show an average spec building size of 143,911 square feet while pre-leased buildings were larger at an average of 203,427 square feet.
While this difference could be attributed to a number of things, a likely reason is that developers and commercial real estate investors will often not begin a large project unless they have secured a certain amount of pre-leasing prior to groundbreaking. If the pre-leasing threshold is not met, the project may be downsized or deferred.
Which Tenants Are Pre-Leasing Space?
When discussing pre-leasing, it’s also important to understand the types of tenants signing deals in new developments and how much space they are absorbing. Are projects being filled by multiple small to medium-sized tenants, or are a few large tenants taking up the space?
Based on our analysis, the latter seems to be the case for most developments.
In our building set, the average deal size came out to 42,088 square feet. To put this in perspective, that means tenants signing leases in a development prior to delivery took up 21% of the building’s total square footage, on average. Below are a few of the tenants contributing to these figures.
| Building | Tenant | Square Feet Leased | % of Building |
| 500 W 2nd | 303,836 | 62% | |
| Quarry Oaks III | Bazaarvoice | 137,612 | 100% |
| Domain 8 | Amazon | 136,584 | 47% |
| Domain 8 | 102,363 | 35% | |
| 3700 San Clemente | Spiceworks | 95,268 | 37% |
| 801 Barton Springs | WeWork | 86,127 | 95% |
| Shoal Creek Walk | Cirrus Logic | 84,872 | 40% |
| Lantana Ridge I & II | Yeti Coolers | 84,459 | 50% |
| Aspen Lake Two | Q2ebanking | 69,936 | 54% |
| Total Building Set | Spec Buildings | Pre-Leased Buildings | |
| Average Lease Size (Square Feet) | 42,088 | 65,951 | 37,877 |
| Average % of Building | 21% | 37% | 18% |
Source: CoStar, 2018
In spec projects, individual tenants are taking up a larger portion of a building’s total rentable square footage than tenants in pre-leased developments. This is great news for developers pursuing spec construction, but it is similar to taking on leverage in an investment; while the upside is larger, so is the downside. If a spec developer is unable to secure one of these tenants during construction, the building will likely be delivered with a significant amount of space still vacant.
How Far in Advance Are Tenants Looking For Space?
Construction time for a new office development can range anywhere from 12 to 36 months, which requires long lead times for tenants wanting to pre-lease. So, why would a long lead time prevent a tenant from pre-leasing?
To understand this better, we looked at AQUILA’s proprietary deals in the market tracking data to understand how long in advance Austin tenants are typically in the market.
This data showed that, depending on the size of the tenant, the average lead time ranges between eight and eleven months.
This is in contrast to the average construction time for the buildings in our analysis of 5.5 quarters, or about 16.5 months. That means for a tenant to pre-lease before groundbreaking, they would need to begin searching for space twice as far in advance as they currently do based on our averages.
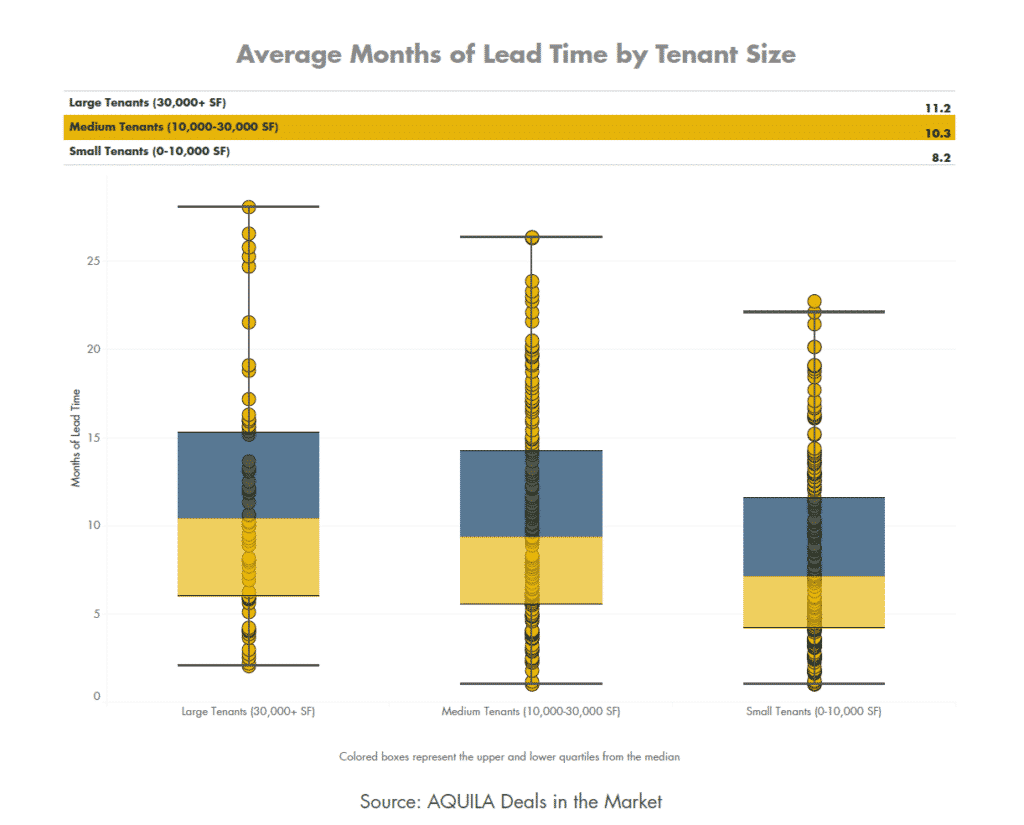
Smaller tenants have an even shorter lead time on average than larger tenants, again reinforcing the idea that large tenants are generally the ones signing pre-leases in new developments.
Of course, each situation will be unique and some tenants could need more or less lead time in different situations, but in general, this could potentially be one of the largest hurdles for a developer looking to lease space before groundbreaking.
Conclusion
Pre-leasing trends are interesting to analyze because of their uniqueness and ability to influence future market conditions. There will always be new and exciting information to uncover, so be sure to watch our website and publishings to stay up to date with all of our research initiatives.
If you would like to learn more about the Austin real estate market, download your free copy of our Austin Office Market Report.

Popular Articles:
- How Office Density Trends Impact Commercial Building Design [Q & A with The Beck Group]
- 3 Reasons Austin, TX is One of the Most Innovative Cities in the U.S.
- How Much Does It Cost to Lease Office Space in Austin, Texas? (Rental Rates, Pricing)


