This article was originally published in AQUILA’s 4Q 2017 Austin Office Market Report and will not be updated. Please contact us if you have specific questions regarding the information in this article.
Any casual observer will tell you that Austin is a quickly evolving city that has undergone major changes since the turn of the century. These changes are evident everywhere, from the ever-increasing population to higher levels of education and income.
Knowing these things to be true in general, we became curious as to exactly how Austin has changed over the past 17 years. By digging through the Census Bureau and identifying key demographic indicators, we have analyzed Austin’s changing demographics and uncovered some interesting conclusions.
In this article, we will:
- Look into how Austin as a city has changed
- Analyze the differences between the primary office submarkets
- Take a deeper look at changes in East Austin
- Compare Austin’s demographics to those of other major cities
Demographics in the City of Austin
The most obvious change Austin has undergone is population growth. Starting at a population of 656,562 in 2000, the city has grown to 947,890 residents in 2016, an increase of 44%.1 Looking at this number, it is no wonder that traffic and parking have become such important topics in Austin today.
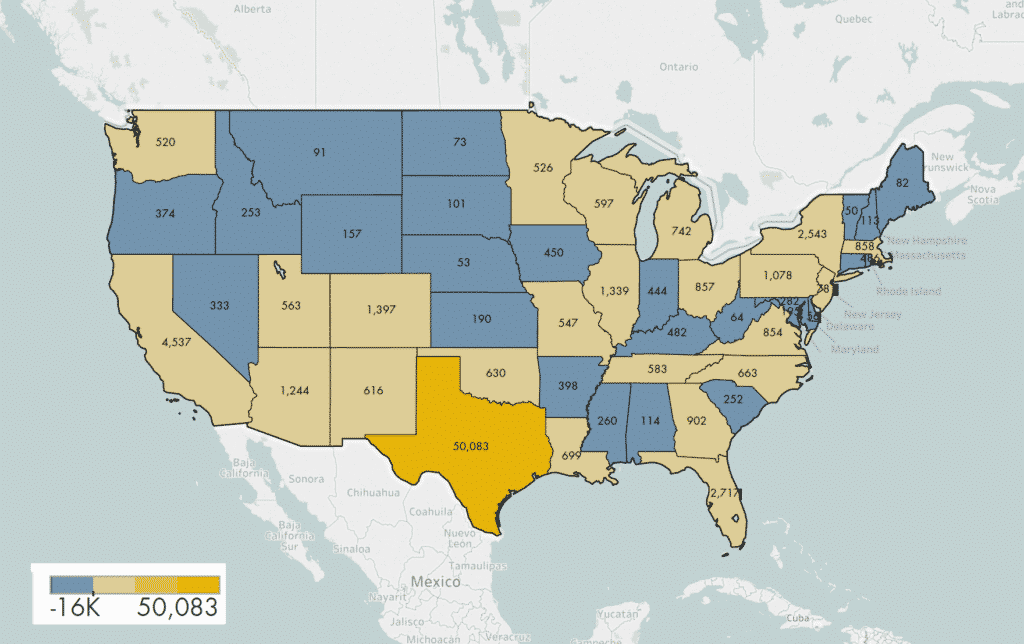
Where do people come from?
As it turns out, a considerable portion of this change in population has come from people moving to Austin from other cities within Texas and around the country. From the map above, you can see that most of this movement takes place within Texas.2
One would think that this massive change in population, combined with Austin’s image as a haven for young creatives and tech talent, would have driven the median population age down from 30 where it was in 2000, but that has not been the case. In fact, the median age for an Austinite in 2015 rose to 32 years old.3
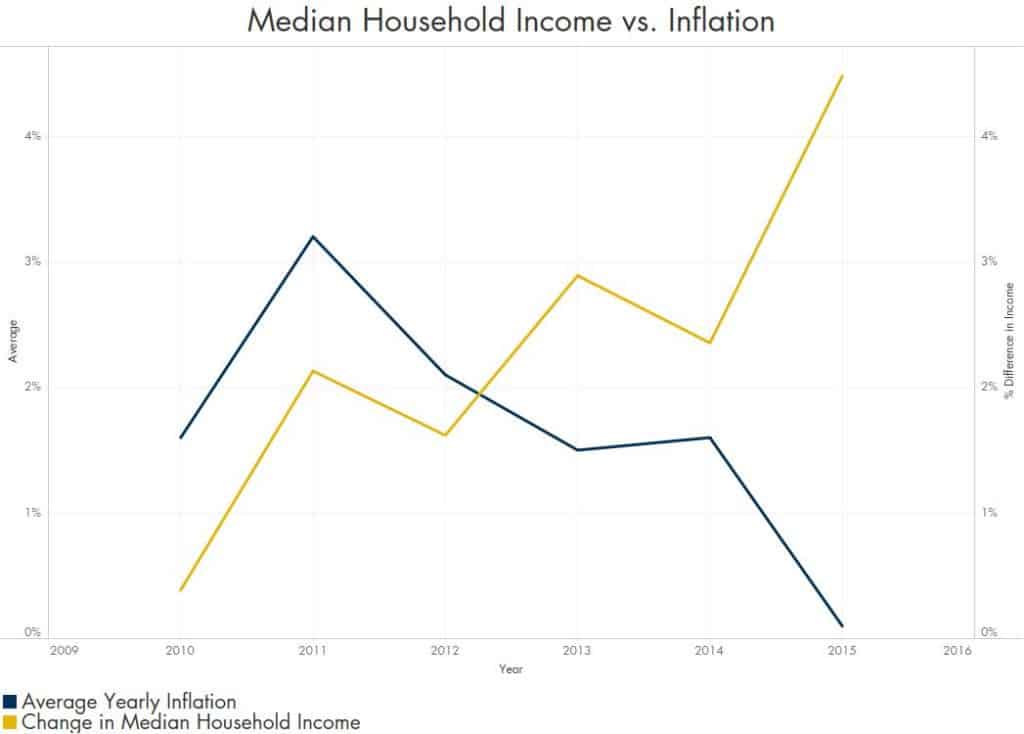
Following along with this increasing age, Austin has also seen a steady rise in median household income. Between 2000 and 2015, median household income grew from $42,689 to $57,689, an average year-over-year change of 2.34%, which follows relatively closely with the average inflation rate over that period of 2.23%. Interestingly, however, median household income growth has been outpacing inflation since 2012.4
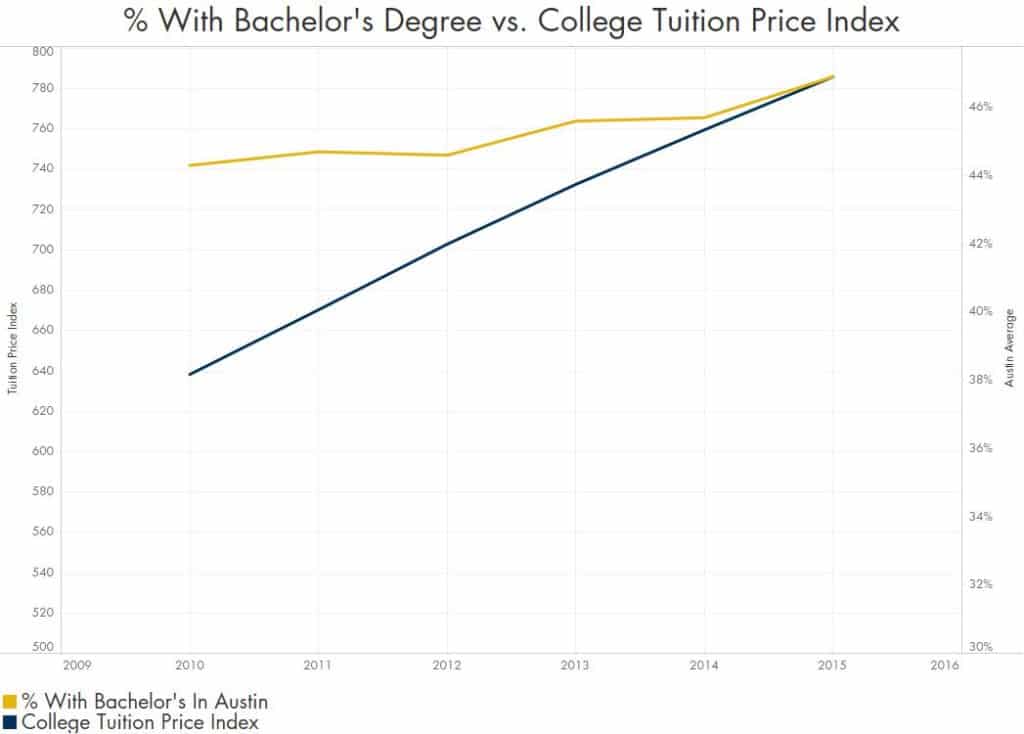
Austin continues to grow more educated too, as measured by the percentage of the population over 18 years old with a Bachelor’s degree or higher. In 2000, 40% of Austin’s population in this category had received a Bachelor’s degree, compared with 47% in 2015.5 While this 7% difference may not seem like much change over 15 years, it is still impressive when you consider the rising cost of higher education over that time period.6 Increasing tuition costs, it seems, have not deterred Austinites from seeking higher education.
Austin Demographics by Office Submarket
What has this meant for our real estate submarkets?
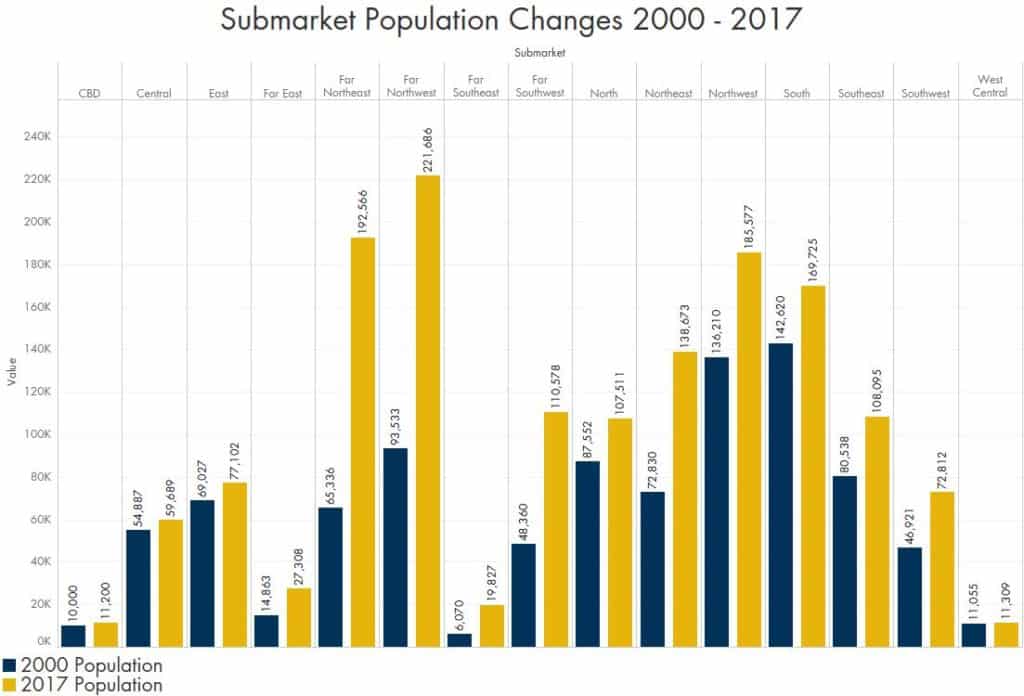
Starting with population change, the Far Southeast submarket takes the cake with the largest growth between 2000 and 2017 of 227%.7 Not surprisingly, populations in the Northwest and Southwest also experienced exceptional growth over this time period due to the increasing number of amenities and higher standard of living in those areas.
Taking a look at median household incomes across submarkets today, it is easy to see where high-income individuals are choosing to call home. The Southwest, with its luxurious homes and Hill Country views, comes out on top with a median income level of $126,839, followed closely by Central and Northwest Austin.
Median age seems to be highly correlated with median income, as the submarkets with higher incomes also tend to be the submarkets with higher median age.
| Median Household Income and Age Levels by Submarket, 2017 | ||
| Submarket | Median Household Income | Median Age |
| CBD | $96,000 | 34 |
| Central | $53,556 | 34 |
| East | $42,858 | 33.4 |
| Far East | $41,476 | 27.6 |
| For Northeast | $74,511 | 32.6 |
| Far Southeast | $62,110 | 33.5 |
| Far Southwest | $101,451 | 39.4 |
| North | $46,958 | 31.4 |
| Northeast | $59,612 | 32.5 |
| Northwest | $82,671 | 36.9 |
| South | $60,126 | 34.9 |
| Southeast | $35,575 | 27.2 |
| Southwest | $126,839 | 40.4 |
| West Central | $104.903 | 37.5 |
Diving into East Austin
The numbers we have looked at so far give a nice overview, but we felt East Austin in particular deserved a closer look as it has become a more prominent office submarket in recent years. The area east of IH-35 has undergone major changes as population pressures have encouraged development, with some parties being in favor of the new developments and others staunchly opposing the ongoing changes.
Whatever your view, we did find some interesting demographic changes in the East submarket since 2000.
In 2000, East Austin’s median household income was $23,348, and the percentage of the population over 18 with a Bachelor’s degree or higher was only 9%. Considering that those numbers for Austin as a whole at the time were $42,689 and 40% respectively, East Austin was well below the average.
However, looking at data for 2017, we see that East Austin has come a long way in 17 years. Median household income has grown to $42,858, an 84% change before inflation or 45% after inflation, and the level of Bachelor’s degrees has risen to 24%, an increase of over 180%.
These are some of the most drastic changes across any of the submarkets, and it will be interesting to see how East Austin continues to evolve.
How Austin’s Demographics Compare to Other Major Cities
Of course, it would not be fair to say that Austin has undergone major demographic changes without comparing those changes to other cities, so we have done just that. The cities to which we chose to make these comparisons are:
- Los Angeles
- Atlanta
- Dallas
- Houston
Starting with population change between 2010 and 2015, Austin far exceeded the other cities on a percentage growth basis. LA. and Houston did add more net citizens, but Austin still exceeded Dallas and Atlanta on a per-person basis.8
| Population by Year and City | |||||
| Year | Austin | Los Angeles | Atlanta | Dallas | Houston |
| 2015 | 930,152 | 3,900,794 | 448,901 | 1,260,688 | 2,217,706 |
| 2014 | 911,390 | 3,862,210 | 440,641 | 1,240,985 | 2,167,988 |
| 2013 | 885,343 | 3,827,261 | 432,589 | 1,222,167 | 2,134,707 |
| 2012 | 864,483 | 3,804,503 | 425,931 | 1,207,202 | 2,107,449 |
| 2011 | 838,599 | 3,782,544 | 419,250 | 1,196,258 | 2,089,090 |
| 2010 | 815,587 | 3,772,486 | 413,462 | 1,187,285 | 2,068,026 |
| Citizens Added | 114,565 | 128,308 | 35,439 | 73,403 | 149,680 |
| Change | 14% | 3% | 9% | 6% | 7% |
Even more impressive is that Austin beat all four cities in the median household income category. Not only was Austin’s 2015 median income the highest, but in every year since 2010 Austin came out on top.
| Median Household Income by Year and City | |||||
| Year | Austin | Los Angeles | Atlanta | Dallas | Houston |
| 2015 | $57,689 | $50,205 | $45,527 | $43,781 | $46,187 |
| 2014 | $55,216 | $49,682 | $46,439 | $43,359 | $50,359 |
| 2013 | $53,946 | $49,497 | $46,631 | $42,846 | $49,318 |
| 2012 | $52,431 | $49,745 | $46,146 | $42,436 | $49,322 |
| 2011 | $51,596 | $50,028 | $45,946 | $42,259 | $48,692 |
| 2010 | $50,520 | $49,138 | $45,171 | $41,682 | $47,112 |
| Average | $53,566 | $49,716 | $45,977 | $42,727 | $48,498 |
With so many prominent universities in and around Austin, it is also no surprise that Austin comes out near the top when looking at the percentage of the population over 18 with a Bachelor’s degree or greater.
| Percent of Population with Bachelor’s Degree by Year and City | |||||
| Year | Austin | Los Angeles | Atlanta | Dallas | Houston |
| 2015 | 47% | 32% | 48% | 30% | 30% |
| 2014 | 46% | 32% | 47% | 30% | 30% |
| 2013 | 46% | 31% | 47% | 29% | 29% |
| 2012 | 45% | 31% | 46% | 29% | 29% |
| 2011 | 45% | 31% | 46% | 29% | 28% |
| 2010 | 44% | 30% | 45% | 29% | 28% |
| Average | 45% | 31% | 47% | 29% | 29% |
Looking at these demographic categories, Austin is clearly growing faster and producing a higher-paid and educated population than many other cities.
What This Means for Austin
As you can see, the changing demographics of Austin paint an interesting picture of where the city has been, where it is now, and where it could go in the future. These demographics influence the lives of Austinites every day, and it is exciting to see that everything points to Austin continuing to be one of the best cities in the country.
Popular Articles
- 3 Reasons Austin, TX is One of the Most Innovative Cities in the U.S.
- Why Austin, Texas is a Best Place to Live & Work (as Ranked in US News, Forbes)
- The East Austin Real Estate Market: The Fourth Office Submarket?

1 Source: U.S. Census Bureau, Population Division
2Source: U.S. Census Bureau, Census Flow Mapper
3Source: U.S. Census Bureau, 2011-2015 American Community Survey 5-Year Estimates
4Source: Bureau of Labor Statistics
5Source: U.S. Census Bureau, Profile of Selected Social Characteristics
6Source: U.S. Census Bureau, College Tuition and Fees in U.S. City Average
7Source: ArcGIS – Esri
8Source: U.S. Census Bureau, Fact Finder


