The Austin commercial real estate market has been on a tear since the dark days of the Great Recession. In a half decade, the city has seen over five million square feet of office space delivered and sales prices per square foot more than double.
This article was originally published in AQUILA’s 4Q 2016 Austin Office Market Report and will not be updated. Please contact us if you have specific questions regarding the information in this article.
Commercial real estate institutional investors are also starting to buy into what Austin has to offer. Over the past three years, Austin has seen a noticeable increase in institutional capital entering the market.1 In fact, in 2016 institutional commercial real estate investors made up 41% of all transactions in terms of dollar value, and institutional-grade assets saw a 30% increase in transaction volume.2
Read Next: What Are Vacancy Rates in Austin, Texas?
Even with strong market indicators, the cyclical nature of real estate and the threat of rising interest rates is causing the question of sustainability in the Austin market to become commonplace. In this report, we take a look into capital markets and leasing trends to determine whether investing in commercial real estate in Austin will continue to provide attractive returns for commercial real estate investors.
The Fundamentals of Investing in Commercial Real Estate Markets
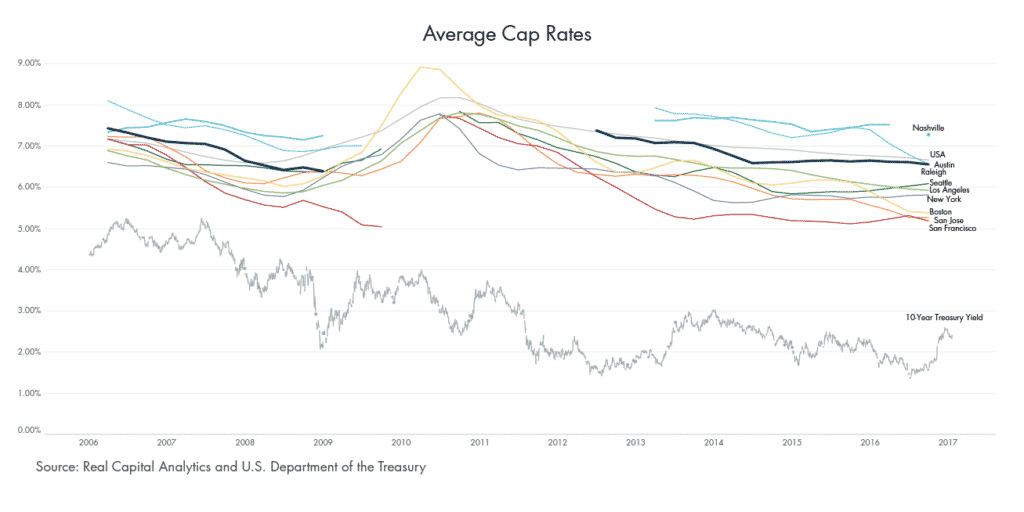
When aggregating cap rates for multiple transactions in a given market and time period, a snapshot of overall commercial real estate investor sentiment towards that market can be achieved as it relates to the overall investment universe. The closer a market’s average cap rate is to a low-risk investment metric, such as the 10-year treasury yield, the more confident commercial real estate investors are that investing in that market will provide them suitable returns for their portfolio or the more secure they feel about their CRE investment.
Large, core markets such as New York and San Francisco have substantially lower cap rates than smaller markets where there is greater opportunity for return and easier-to-deploy capital. In terms of downside risk and net dollars returned, investing in these smaller markets might not make sense to CRE investors – especially sophisticated institutional investors who are looking to deploy large amounts of capital into core assets.
So, where does the Austin office market fit into this matrix of CRE investments? There are many factors that come into play when determining whether a market is worth investing in. Cap rates are just the tip of the iceberg when it comes to measuring the value of a CRE investment. Factors such as rental, vacancy, and employment rates can be measured, while geography, overall desirability, and the likelihood that the market will continue to be “hot” or “cold” cannot. The closest we can get to measuring such values is to look at the market value, or the amount of money someone is willing to pay for the opportunity to realize the potential benefits of the future desirability of an investment. So let’s take a look at the dynamics of the Austin investment scene. (For a list of assumptions maintained in this analysis, see the end of this article.)
How Does the Austin Commercial Real Estate Market Compare?
For this analysis, we picked a competitive set of markets to compare to Austin: including San Francisco, New York, San Jose, Seattle, Los Angeles, Boston, Nashville, and Raleigh.
In terms of average sales price, Austin currently ranks towards the bottom of this list, with an average sales price of $309/sf, beating out only Raleigh ($165 per square foot) and Nashville ($185 per square foot), with the nationwide average sales price at $250 per square foot.4 Not surprisingly, New York and San Francisco properties are trading at the highest values, coming in at $451 per square foot and $578 per square foot, respectively.
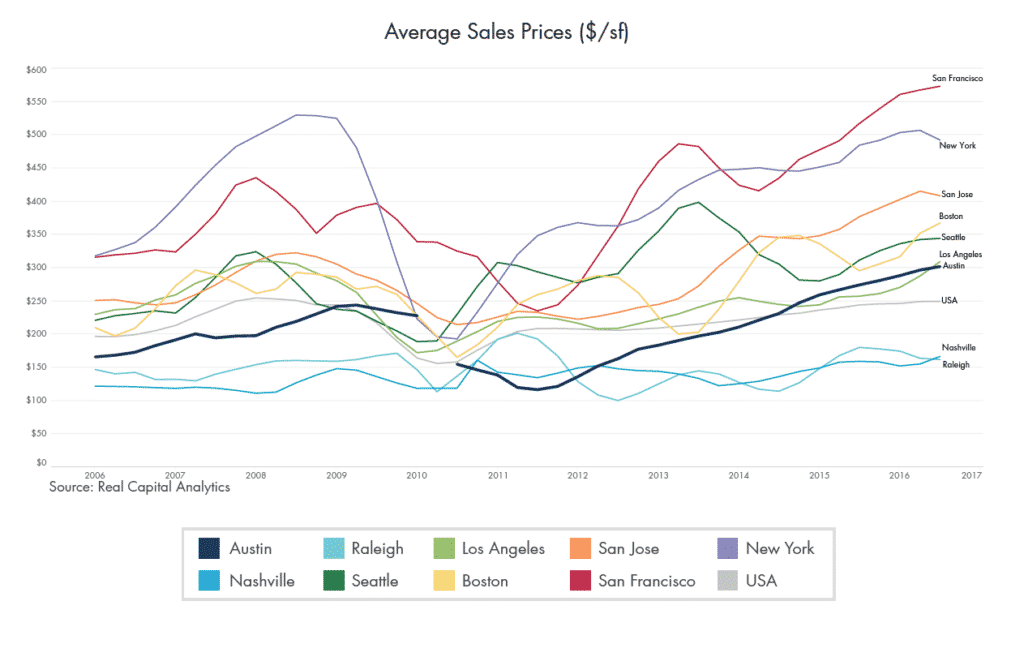
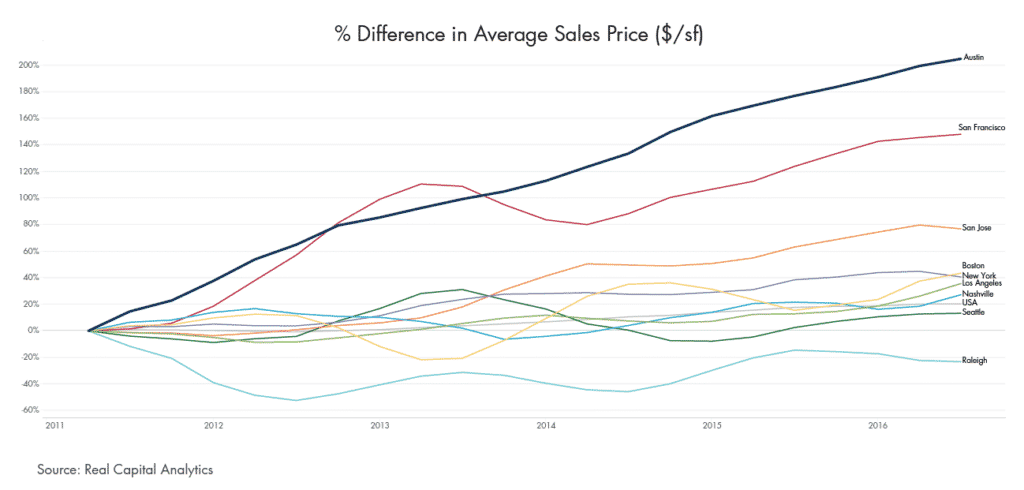
In terms of recent growth over time, however, Austin blows the other markets out of the water. Going back to 2011, when commercial real estate activity started to pick back up following the end of the Great Recession, Austin sales prices per square foot have increased by over 200%, going from an average of $99 per square foot in 2Q 2011 to the over $300 per square foot we see today. The only other market to more than double over the same time period is San Francisco, which leaped from $231 per square foot to $578 per square foot.
Historically, the average value of Austin’s sales has been on par with or below the national average. Then, in 2011, sales prices began a very steady march upward, surpassing the national average in 2014 and today almost 25% higher. Despite this dramatic increase, cap rates in Austin have remained relatively flat over the past three years.
How to Measure the Health of a Commercial Real Estate Market
Much like there are many ways to determine the health of any investment, there are many ways to measure the health of a market. Employment rates, GDP, and inflation are all very useful metrics in determining the strength of an economy, but these do not fully capture the commercial real estate behavior. When looking at common commercial real estate leasing metrics such as rental rates, vacancy rates, absorption, etc., it is difficult to compare markets to one another, as each market’s quarterly performance is viewed relative to its historical trends, market size, etc.
For our analysis, we want to measure the health of a market’s commercial real estate industry from a potential CRE investor’s perspective by combining leasing and sales metrics to create an overall “Health Index.”
For our purposes, we defined the Health Index as the ratio of rent being paid to the rent not being paid in a specific market. To measure the rent being paid in a market, we took the implied net operating income for the sales of the market, multiplied by the occupied square feet. To measure the rent not being paid in a market, we multiplied the total vacant square feet by the average asking rental rate.

While these are not scientific measurements, they can be a useful tool to compare markets, look at trends over time and normalize demand across markets of varying sizes. The Health Index attempts to measure CRE investment opportunity by combining investor sentiments with the leasing environment. If a market has a high Health Index rating, it can be attributed to factors such as high NOI, high occupancy, and/or high rental rates. When you have a high Health Index, in most cases, it’s because all of these factors are moving in sync.
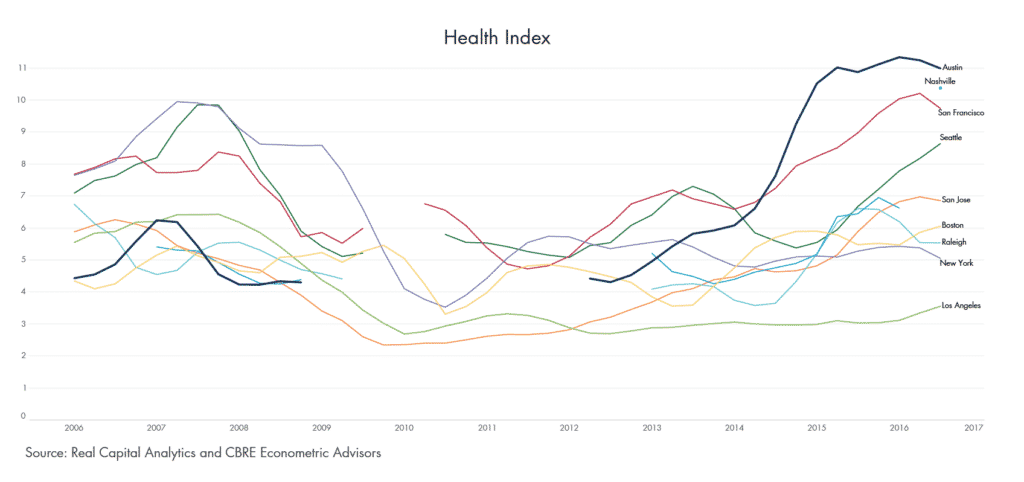
So, how does Austin stack up against its competitors in terms of health? Very well. In fact, it has been the “healthiest” for the last eight quarters.
Read Next: Why Austin, Texas Is One of the Best Cities for Business
The Health Index on the next page also helps visualize worst-case scenarios. If there were a nationwide economic collapse where employment growth went to zero and CRE investors were caught with their pants at their ankles because there would be no new demand for space in their properties, those with holdings in Austin would be in the best situation given the relationship between low vacancy rates and high average implied NOI. If a CRE investor was holding a 100,000 sf property in New York at 10% vacant with no demand for that vacant space, they would virtually be losing $638,800 per year of possible income on that vacant space – a space for which they paid roughly $500 per square foot.
In Austin, however, a 100,000-square-foot property costing roughly $300 per square foot at 10% vacant and no possibility of leasing would only be losing the CRE investor $237,800 per year.4 In other words, a CRE investor choosing New York over Austin would have paid roughly 1.6 times as much to lose 2.6 times as much as the CRE investor who chose Austin.
Looking Back to See Forward: Will the Austin Market Remain Healthy?
When looking at the Health Index above, one of the most obvious questions is how sustainable is Austin’s health. Will Austin’s health trajectory follow that of New York’s in 2008, or has Austin already seen its peak?
While nearly every market’s health suffered during the last recession, New York never bounced back as much in recent years as other markets after being near or at the top every quarter prior to the recession. From a fundamental point of view, the driving factor of New York’s lack of rebound can be attributed to a supply and demand issue: there was too much product being delivered in relation to employment growth.
From 2009 to 2015, the employment growth in New York was among the lowest among this competitive set of markets in terms of percentage change – increasing just 7.5% over the seven-year period. Meanwhile, Austin’s employment growth has been the highest among the competitive set, increasing by more than 30% since 2009. The chart below illustrates that Austin has added the least amount of office space (supply) relative to employees added (demand).
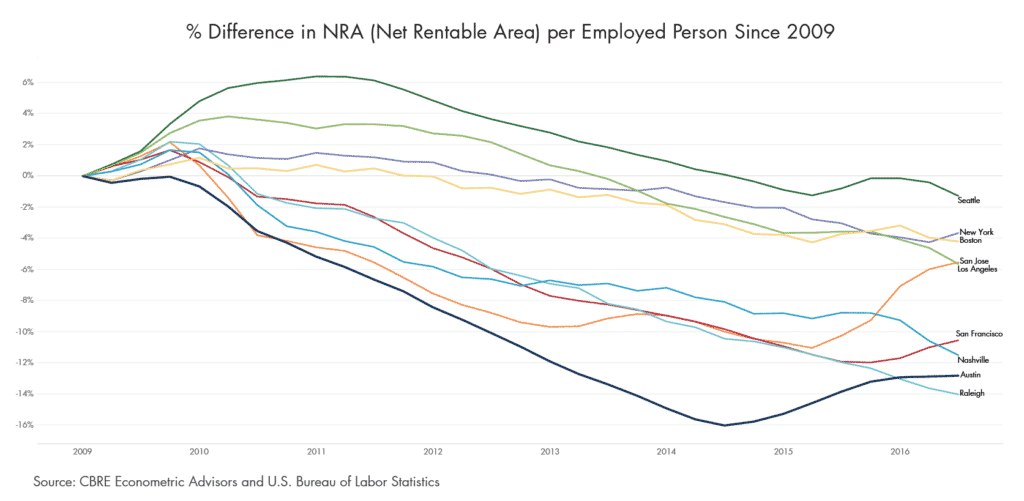
Austin’s conservative growth in office supply over the past seven years plays an important role in the overall investment scene as well. Institutional capital typically represents a likely source of CRE investment in new office product upon stabilization. As new buildings are typically anchored by long-term leases with good credit tenants, these projects trade at relatively low cap rates. Limited new construction has yielded a limited opportunity to invest in CRE in this corner of our market and could be a contributing factor to cap rates sustaining their relatively higher levels.
This extreme growth in employment relative to market size further sets Austin apart from its peers in the coming years. As employees and employers expand or migrate their operations from the coasts to the more business-friendly state of Texas, employment will continue to provide ample opportunity for commercial real estate investments in the area. Furthermore, when compared to its in-state rivals of Dallas, Houston, and San Antonio by the folks on the coasts, Austin is often desirable for relocations because of its unique culture and geographical features.
Barring an economic downturn – and so long as owners, developers and lenders continue to proceed as cautiously as they have in recent years – the tightening of the market squeezing rents upwards should continue to bring great value to CRE investors. Increasing rental rates brought about by high occupancy levels should continue to provide solid returns to CRE investors, and continue to make Austin an attractive increment market that is not too late to buy into.
Read Next: How Much Does It Cost to Lease Office Space in Austin, Texas? (Rental Rates, Pricing)
Assumptions
1. CRE Investor allocations are consistent
This analysis assumes that overall investor sentiment towards commercial real estate remains consistent with historical trends. That is to say that there are not more or fewer investment dollars flowing into or out of commercial real estate and into other investment forms. This ensures that, looking forward, values are not inflated or deflated due to an economy-wide shift in demand for commercial real estate. Furthermore, this assumption ensures that there are ample transactions occurring in the market to encapsulate overall market trends and CRE investor sentiments.
2. Access to capital is consistent
One of the primary drivers of commercial real estate transactions is the accessibility CRE investors have to capital from financial institutions. If commercial real estate loans dry up nationwide, then transactions will become sparser, or market values will be skewed due to an abnormal lack of capital. For example, in the last economic downturn from 2008 to 2012, there were not enough transactions recorded in Austin to surmise any sort of market-wide trends due to an essential halt in banks’ appetites for providing commercial real estate financing. This analysis assumes the demand for commercial real estate on a national or global level does not shift towards other vehicles such as stocks and bonds on a level that will affect all commercial real estate markets moving forward.
3. Inflation remains steady
The return on a CRE investment is only as good (or bad) as its relative ability to purchase or invest in goods at the time of sale. Real estate offers some protection against inflation as rental rates provide increased cash flow in a high-inflationary period. However, this affects cap rates as well, as the numerator (Net Operating Income) could increase disproportionately to the value at which an asset will be sold.
Given these assumptions, the primary driver of market values in this analysis is the supply/demand dynamic of each market.
If you would like to learn more about the Austin real estate market, download your free copy of our Austin Office Market Report.
Popular Articles:
- Evaluating a Property: Underwriting Commercial Real Estate Acquisitions
- Best Commercial Real Estate Investment Sales Brokerage Firms to Buy and Sell Property in Austin, Texas
- Your Guide to Commercial Real Estate Investment Language and Lingo [Glossary, Definitions]
1Institutional investor is defined as investors such as hedge funds, investment banks, life insurance companies, pension funds, etc. who typically deploy capital into assets worth at least $40 million.
2Source: Real Capital Analytic
3Calculations based on current market conditions according to Real Capital Analytics and CBRE Econometric Advisors

